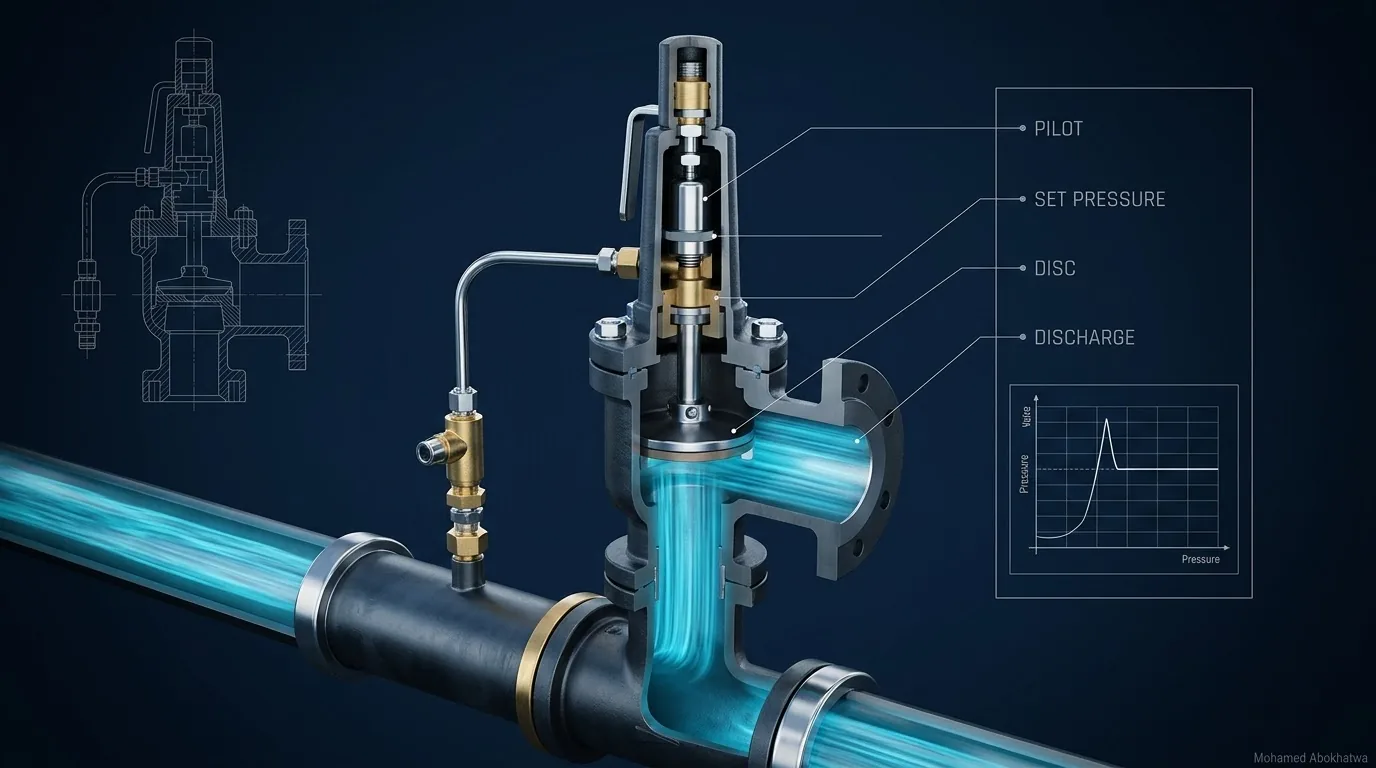
A surge relief valve at the pump discharge is the cheapest-looking answer to a pump-trip upsurge, and on the 12 km DN800 reference main it caps its own connection well. Set at 95 m — lower than a station could hold in service, so a best case — it holds the pump end at 96.3 m where the unprotected line reaches 165–190 m. Everywhere else, the main still falls to vapour pressure from end to end, and the peak along the line remains 127–143 m depending on how the cavity is modelled — straddling the 136 m PN16 allowable. On a line that separates, the valve belongs behind the real protection, not in front of it.
1 · What a relief valve is for
A surge relief valve (SRV) is a normally closed valve that opens when the pressure at its connection exceeds a set point, and discharges to atmosphere or a sump. It acts on high pressure only, so it cannot put water into a line whose pressure is falling, and at its own connection only, reaching the rest of the line only through the waves that node sends out [1, 2].
A hydropneumatic vessel feeds the downsurge and absorbs the upsurge; a flywheel keeps the column moving; a one-way surge tank feeds a high point. The relief valve is only a pressure cap, so the design question is not whether it can cap the pump end but where the pressures that exceed the pipe rating are generated [3]. On a line that separates, most of those places are far from the pump.
2 · Where the upsurge on a pump trip comes from
Every head change in a transient is tied to a flow change by the Joukowsky relation, with the pipe’s characteristic impedance \(B\):
On the reference main — 12 km of DN800 ductile iron K9 to ISO 2531 [4], wave speed 1,050 m/s, 0.70 m³/s at 1.39 m/s, flat profile — stopping the full flow is worth \(B \times 0.70\) = 149.1 m, but only 85.0 + 9.8 = 94.8 m is available above vapour at the pump. When every pump trips, the pump end drops straight to −9.8 m and the whole line is at vapour within 11.4 s. Then, in the vapour cavity model:
- 0–25 s. A large cavity opens at the pump and small ones along the line; the small ones close as the reflection returns from the delivery reservoir.
- 47 s. The column, running back at about 0.50 m³/s, closes the pump cavity against the shut check valve: \(B \times 0.50\) lifts the pump end from −9.8 m to about 97 m in one step.
- 47–58 s. That front runs down the line and stops about 0.47 m³/s of the flow coming back out of the reservoir, adding about 100 m to the 44.8 m already there. The far-end peak is generated 11–12 km from the pump.
- 47–68 s. Later waves keep arriving at the pump, and its head climbs steadily to about 142 m — the climb that opens a 110 m valve at about 50 s and a 120 m valve at about 55 s.
- 69 s. Reflections reach the closed check valve, which doubles them [5]: the unprotected pump-end peak of 165–190 m.
Why collapse peaks are quoted as ranges
The results come from a method-of-characteristics model with a vapour cavity model, cross-checked with a gas cavity model and an independent second code (120 reaches, 150 s runs). They are not HAMMER output; a project analysis must be run in HAMMER, or an equivalent package, on the real profile. Maxima that follow a collapse are quoted as a range across the two models, because the spike depends on how the cavity is represented: one closes a concentrated cavity in an instant, the other cushions the closure with a trace of free gas [1, 6]. Here the gas cavity model gives line maxima 10–13 % lower, an undersized valve’s pump-end peak about a fifth lower, and peak relief flows a third or more lower. A finer grid does not close the gap: at 95 m the line maximum moves by less than 1 m between 60 and 240 reaches, against about 17 m between the two models.
3 · Worked example: one valve, four settings
The valve is a spring-loaded relief valve on the pump discharge header, downstream of the check valves, discharging to atmosphere. It opens in proportion to the head above its set point and reaches full lift at an overpressure of 4 m. The discharge law, the usual form of a valve boundary in a characteristics model [7], is
with \(h\) the head at the valve, \(H_s\) the set head, \(\Delta h_{op}\) = 4 m and \(C_d A\) for DN250 at \(C_d\) = 0.6. Three idealisations matter, and a project model must replace each: all pumps stop instantly behind an ideal check valve, with no rundown (the bounding case for the downsurge; a real rundown changes when and how hard the column returns); the valve has no dynamics — no opening delay, closing time or blowdown (section 9); and the nominal bore is taken as the flow area.
Three settings are modelled: 120 m, 110 m and 95 m. Read 95 m, only 10 m above the steady head, as the best case for the valve rather than a usable setting: it is below the shut-off head of the series’ model pump, so the valve would open in service (section 9).
| Set head | Pump-end max, vapour / gas model (m) | Line max (m) | Length above 136 m, vapour / gas (km) | Line min (m) | Peak relief flow, vapour / gas (m³/s) |
|---|---|---|---|---|---|
| No valve | 165–190 | 165–190 | 12.0 / 11.0 | −9.8 | – |
| 120 m | 120.9 / 120.5 | 140–155 | 11.9 / 3.9 | −9.8 | 0.319 / 0.179 |
| 110 m | 111.0 / 110.6 | 133–151 | 10.0 / 0 | −9.8 | 0.359 / 0.220 |
| 95 m (best case) | 96.3 / 95.9 | 127–143 | 1.6 / 0 | −9.8 | 0.416 / 0.280 |
The valve does its own job in every case, holding the pump end within 1.3 m of the set point. It does nothing for the minimum, −9.8 m throughout. The line maximum falls with the set point but never clearly below 136 m: over it under both models at 120 m, model-dependent at 110 m and 95 m. The peak relief flow at 95 m, 0.416 m³/s in the vapour cavity model, is 59 % of the pumped flow.
4 · Interactive: the pump end, second by second
Pick a setting and watch the head at the valve; the faint trace is the same trip with no valve.
At 95 m the pump end sits at vapour for 47 s; the valve opens the instant the cavity closes and holds 95.0–95.7 m. At 69 s, where the unprotected trace spikes to about 190 m (165–190 m across the two cavity models), the valve opens further and the head reaches 96.3 m. At 110 m and 120 m it opens part-way up the climb after the collapse. Every setting gives the same pattern: an excellent result at the valve in this no-delay model, −9.8 m on the line, and a line maximum the valve cannot settle.
5 · Why the line still fails — or might not
The valve removes the doubling at the check valve, which lowers the envelope near the pump: at 6 km the maximum falls from 150–160 m unprotected to 120–130 m at a 95 m setting. The far end is governed by the front that left the pump at 47 s at about 97 m — barely touched by a 95 m valve, and untouched by a 110 m or 120 m valve that has not yet opened. In the vapour cavity model the 120 m envelope matches the unprotected one from 8.0 km onwards, and the 110 m envelope from 10.7 km.
Then comes the model question. At 95 m the vapour cavity model peaks at 11.9 km and leaves the last 1.6 km above 136 m; the gas cavity model peaks lower, at 11.1 km, and leaves none. Honestly quoted, the line maximum is 127–143 m, with 136 m inside the range. Higher settings only lengthen the stretch over the allowable (table 1).
Why a lower set point cannot fix it
The set point cannot go below the pumps’ shut-off head plus a margin (section 9), and the governing front leaves the pump at about 97 m: \(B\) times the returning flow, counted up from vapour pressure. A relief valve set at or above that head barely touches it. Near the reservoir the same front is counted up from 44.8 m, which is why the envelope rises towards the delivery end. Only a device that stops the column separating removes the returning flow; a valve already open when it returns might discharge part of it (the anticipator, section 9).
6 · Interactive: along the line
The shaded band between the two maximum envelopes is the part of the answer that belongs to the cavity model rather than to the valve.
At 95 m the upper edge of the band crosses 136 m over the last stretch before the reservoir and the lower edge does not; step through the settings to see the lengths in table 1 build up. Against the grey unprotected line, the valve pulls the envelope down near the pump and leaves the far end alone. The minimum envelope never moves.
7 · Sizing the valve: flow first, then bore
A relief valve is sized for a flow, and the flow is a transient result: at the 95 m setting, 0.416 m³/s in the vapour cavity model and 0.280 m³/s in the gas cavity model. The peak is collapse-driven too, so size for the larger.
A first estimate before the model
Without the valve the waves lift the pump end to the unprotected peak \(H_u\); with the valve open near \(H_s\), the flow behind the difference has to leave through it:
The model gives 0.280–0.416 m³/s. The estimate runs 7–17 % high because each discharge weakens the waves that follow — the right side to err on when choosing sizes to model.
Capacity at full lift, Kv and Cv
Full lift is reached at the set head plus the overpressure, so the capacity at full lift, discharging to atmosphere, is
— 1.298 m³/s for DN250 at a 95 m set head and \(C_d\) = 0.6, with the other sizes in the table. Manufacturers usually quote a flow coefficient, so convert the required flow at the set pressure, 95 m or 9.32 bar:
The same law gives the head at the valve, \(h = H_s + \Delta h_{op}\,Q_r / (C_d A \sqrt{2gh})\): 96.3 m for DN250, 97.0 m for DN200 and 98.5 m for DN150 at the flows the model computes — its pump-end maxima to 0.1 m. Once the valve is big enough, its own characteristic sets the pump-end result.
| Valve | Capacity at full lift (L/s) | Capacity ÷ required | Peak relief flow, vapour / gas (L/s) | Pump-end max, vapour / gas (m) | Line max (m) |
|---|---|---|---|---|---|
| DN100 | 208 | 0.50 | 242 / 219 | 110–134 | 127–143 |
| DN150 | 467 | 1.12 | 407 / 274 | 98.5 / 97.4 | 127–143 |
| DN200 | 831 | 2.00 | 413 / 278 | 97.0 / 96.4 | 127–143 |
| DN250 | 1,298 | 3.12 | 416 / 280 | 96.3 / 95.9 | 127–143 |
| DN300 | 1,869 | 4.49 | 418 / 281 | 95.9 / 95.6 | 127–143 |
DN100 is undersized: its capacity at full lift is half the requirement, and it passes 242 L/s only because the pump end climbs to 110–134 m, a collapse-driven range again because the valve has lost control. From DN150 up the pump end is controlled, and each size step buys less than 1.5 m. DN150 works near full lift, with no margin for a lower installed discharge coefficient or a slower valve, so in our judgement DN200 or DN250 is the choice. The last column never moves: the line maximum is indifferent to the size of the valve.
The discharge side
At 0.416 m³/s a DN250 outlet runs at 8.5 m/s, and the model discharges 3.3–4.4 m³ per trip at 95 m (vapour and gas cavity models) — one event, not a sump volume. The discharge pipe must not throttle the valve, the sump or return must take the peak flow and repeated trips without backing up, and a valve venting at over 9 bar needs a splash guard and safe access [3, 9].
8 · Interactive: sizing the valve
The left axis carries the transient sweep at 95 m; the right axis carries the capacity at full lift for your inputs, against the flow you require.
At the defaults the valve has 1.298 m³/s at full lift, 3.12 times the requirement, and settles at 96.3 m, a third of the way to full lift. At DN150 the ratio falls to 1.12 and the head rises to 98.6 m, nearly wide open; at a discharge coefficient of 0.45, DN150 is no longer enough. Raising the set head lowers the first estimate but not the sweep, which stays at 95 m; how the set point moves the line maximum is in figure 2 and table 1 (127–143 m at 95 m, 140–155 m at 120 m).
9 · Set pressure, reseating and the anticipator
Choosing the set point
Too high a set point exposes more of the line (table 1). Too low, and the valve opens in service: it must clear a second pump starting, a control valve moving and, above all, a delivery valve closed against running pumps, which takes the pump end to the shut-off head. The model pump of the pump inertia article in this series has a zero-flow head of 105 m (100 m above a 5 m suction), so a 95 m valve would discharge whenever the flow was throttled below about 0.50 m³/s. In our judgement a setting that clears 105 m with the valve’s tolerance is nearer 110–120 m, which leaves 10.0–11.9 km above 136 m in the vapour cavity model (none to 3.9 km in the gas cavity model). In our practice the set point comes from a run of the normal operating events — their highest head plus the set-point tolerance — and the trip is rerun at that setting.
ISO 4126-1 supplies the vocabulary [10]. The overpressure is the rise above set pressure needed for full lift (4 m here); the reseating pressure is where the valve closes again, and the difference from the set pressure is the blowdown — too long and the valve dumps water after the transient, too short and it chatters. On the pipe side, EN 805 distinguishes the design pressure from the maximum design pressure, which adds a surge allowance [11]: set point plus overpressure must not exceed the maximum design pressure, and nor may the maximum envelope anywhere along the line.
Spring-loaded or pilot-operated
A direct-acting valve holds its disc shut with a spring; a pilot-operated valve uses a small pilot, sensing line pressure, to control the chamber above the main valve — conceptually, simplicity against closer control of set point and closing speed [2, 3]. Neither opens instantly, and here the valve first opens at the worst moment: at 95 m on the cavity collapse itself, a step of about 106 m in one time step; at 110 m and 120 m part-way up the climb that follows. Without the valve the pump end rises from 96.5 m at the collapse to 102.3 m by 48 s and 109.0 m by 49 s, so a valve that takes a second or two to open lets the head run up that climb and sends a higher front towards the far end. Model the manufacturer’s opening and closing times before relying on any number here.
The surge anticipator valve
A surge anticipator valve (SAV) opens on the initial low pressure after a trip, so it is already open when the return wave arrives, and then closes slowly [2, 12]. That removes the opening-time problem, but it neither prevents separation nor feeds the downsurge. Being open when the column returns, it may lower the collapse front that governs the far-end peak; that has to be shown by modelling it, including its behaviour while its connection is below atmospheric pressure — the question behind air admission. No anticipator was modelled here.
10 · Where a relief valve is the right answer
None of this makes the SRV a bad device, only one with a narrow job. In our judgement it fits in three places, and fails in a fourth:
- Where the downsurge stays above vapour. With a low velocity, a slow rundown or a protected downsurge, the upsurge is the returning wave at the check valve, and a relief valve there caps it where it is generated.
- Upstream of a closing valve on a gravity line, where the closure generates the upsurge: slow the closure first and keep the relief valve as the backstop (control valve closure, control valve transients in HAMMER).
- Behind a vessel, as a backstop that caps the pump header if the vessel is isolated, short of gas or wrongly charged. It must stay shut while the vessel works, so here it would sit above the vessel’s 119.2 m line maximum, at 120 m say — and with the vessel out of service the line would still see 140–155 m (section 3). The vessel’s availability is the real protection; record it in the surge risk review.
- Not as the primary pump-trip protection on a line that separates, like this one [9, 12].
| Option | Line min (m) | Line max (m) | What it protects |
|---|---|---|---|
| No protection | −9.8 | 165–190 | Nothing: column separation along the line |
| Relief valve DN250, set 95 m (best case) | −9.8 | 127–143 | The pressure side, at the valve |
| Flywheel, total I = 400 kg·m² | +9.3 | 85.0 | Both sides, by keeping the column moving |
| Vessel 20 m³, 3.5 m³ gas, differential DN400 connection | +4.3 | 119.2 | Both sides, at the pump |
The two options that stop the column separating remove the collapse upsurge and keep the maximum within the rating (119.2 m and 85.0 m). That is the argument of this series in one table, worked through in choosing surge protection on one pipeline.
11 · Setting it up in Bentley HAMMER
Field names differ slightly between HAMMER versions, so read them as descriptions of intent [13]. The HAMMER transient workflow and HAMMER transient tips cover the general run set-up.
- Build and check the steady state. Reservoir, Pump, Pipe and delivery Reservoir on the real profile, with each Pipe’s wave speed from the Wave Speed Calculator (wave speed).
- Define the trip. On the Pump: a pump trip (shut down) at time zero, pump and motor inertia from the datasheets, 4-quadrant characteristic curves (from specific speed if the manufacturer’s are not available), and the check valve on the pump with its closure time or delay.
- Run it unprotected for several times 2L/a (150 s here, against 22.9 s), with the computed time step, a tight wave speed adjustment tolerance and vapour pressure / column separation on. Read the profile (path) with maximum and minimum head envelopes: if the line reaches vapour, the relief valve is not the primary device.
- Fix the threshold pressure from normal operation. Run a pump start, a controlled stop, control valve movements and a delivery valve closed against running pumps. Set the threshold (set) pressure above the highest head at the pump discharge node by the valve’s set-point tolerance.
- Add the Surge Valve at the pump discharge node, downstream of the check valves, as a surge relief valve: the threshold pressure from step 4, size and discharge coefficient, and time to open and time to close (or the opening and closing characteristics) from the manufacturer. An instantaneous opening is only a bounding sensitivity, and this article’s figures come from a different model, so do not expect to reproduce them. Rerun the step 4 events with the valve in place and confirm it stays shut.
- Build the comparisons. At least three valve sizes around the first estimate from section 7 as separate scenarios, with any higher set points as alternatives above the step 4 value.
- Read the pump end. In the Transient Results Viewer, plot the time history at the valve node: the head should stay within the overpressure of the set point. Note when the valve first opens and, if your version reports it, the peak discharge.
- Read the whole line. Plot the profile (path) envelopes for every scenario, check the maximum against the pipe rating along the full length, and use the animation to see where the high heads are generated.
- Check the minimum separately. The relief valve does nothing for the downsurge; the minimum envelope must meet the design minimum (+3.0 m here) by other means, or every maximum on the line is a collapse result.
- Test whether the verdict holds. Rerun any scenario that separates with different column separation settings. If the verdict against the pipe rating changes, the protection must change. A finer time step checks convergence but will not remove the cavity-model uncertainty.
12 · Design checklist
- Run the trip unprotected first. If the line reaches vapour, a relief valve is not the primary protection.
- Set the valve from a normal-operations run, above every normal event and the pumps’ shut-off head plus tolerance, then rerun the trip.
- Size for flow. Screen with \((H_u - H_s)/B\), then take the peak relief flow under the harsher cavity model.
- Choose a size that controls the pump end with margin at the installed discharge coefficient, not the smallest that reaches full lift, and give the manufacturer Kv or Cv at the set pressure.
- Model the manufacturer’s set-point tolerance, overpressure, reseating pressure and opening and closing times — the first opening can coincide with a cavity collapse.
- Read the whole-line envelopes, quote collapse-driven maxima as a range, and reject any scheme whose compliance depends on the cavity model.
- Design the discharge — drain, sump or return, splash protection, access — for the peak flow and repeated events.
- Record the residual risk in the surge risk review, and hand the settings and their reasons to operations so nobody raises the set point to stop a nuisance discharge (transients and SCADA).
- Wave speed: the number that sets the surge
- The differential orifice: empty freely, refill slowly
- Bladder, diaphragm or air-over-water vessel
- One-way surge tanks at the knee
- Surge relief valves: what a valve at the pump can protect
- Pump inertia and the flywheel
- Choosing surge protection on one pipeline
References & standards
- Wylie, E.B. & Streeter, V.L. Fluid Transients in Systems. Prentice Hall, 1993 — method of characteristics, pump and valve boundary conditions, column separation and the discrete vapour and gas cavity models.
- Chaudhry, M.H. Applied Hydraulic Transients, 3rd ed. Springer, 2014 — surge relief valves, surge anticipator valves and their representation in transient models.
- Thorley, A.R.D. Fluid Transients in Pipeline Systems, 2nd ed. Professional Engineering Publishing, 2004 — surge control devices, relief valve types and practical application on pumping mains.
- ISO 2531 Ductile iron pipes, fittings, accessories and their joints for water applications — the K9 ductile iron main of the reference system.
- Parmakian, J. Waterhammer Analysis. Dover, 1963 — pump discharge lines after power failure, the returning wave at a closed check valve, and relief valves.
- Bergant, A., Simpson, A.R. & Tijsseling, A.S. “Water hammer with column separation: a historical review.” Journal of Fluids and Structures, 22(2), 2006 — why cavity collapse peaks depend on the cavity model, and the vapour and gas cavity models compared.
- Larock, B.E., Jeppson, R.W. & Watters, G.Z. Hydraulics of Pipeline Systems. CRC Press, 2000 — valve discharge boundaries and orifice-type discharge laws in characteristics models.
- Swaffield, J.A. & Boldy, A.P. Pressure Surge in Pipe and Duct Systems. Avebury Technical, 1993 — pressure surge following column separation and the limits of local pressure relief.
- Stephenson, D. Pipeline Design for Water Engineers, 3rd ed. Elsevier, 1989 — protection of pumping lines, where relief valves suit and where they do not, and discharge arrangements.
- ISO 4126-1 Safety devices for protection against excessive pressure — Part 1: Safety valves — terminology: set pressure, overpressure, reseating pressure and blowdown.
- EN 805 Water supply — Requirements for systems and components outside buildings — design pressure, maximum design pressure including surge, and the surge allowance.
- Boulos, P.F., Karney, B.W., Wood, D.J. & Lingireddy, S. “Hydraulic transient guidelines for protecting water distribution systems.” Journal AWWA, 97(5), 2005 — surge relief and surge anticipating valves among the protection options, and their limits.
- Bentley Systems. OpenFlows HAMMER product documentation and help — Surge Valve, Pump and Pipe properties, transient run options and the Transient Results Viewer.