Q1 — Why Are My Results Worse After I Add Air Valves?
This is the most common surprise Jesse encounters. An engineer adds a combination air valve at the high point, reruns the simulation, and finds that maximum pressures are now higher than the unprotected baseline. The profile envelope looks worse, not better.
The air valve is not broken. The model is showing you a real physical mechanism: air pocket collapse.
What actually happens
- Pump trips at t = 3 s. Pressure drops at the pump discharge.
- The pressure drop wave reaches the air valve location. Pressure falls below atmospheric. Air is admitted through the inlet orifice — the upstream water column has separated, creating a pocket.
- Positive pressure returns from the downstream reservoir. The air pocket is now squeezed back toward the valve. Air is expelled through the outlet orifice.
- If the outlet orifice is too large, air is expelled too quickly. The two adjacent water columns were moving toward each other to push the air out. When the last bubble leaves, they have nowhere to go — they collide. This is nearly identical to an instantaneous valve closure: a sudden momentum change, a Joukowsky surge, and a secondary pressure spike that can exceed the original pump shutdown transient.
Without profile animation enabled, you see only the maximum envelope — and you cannot tell whether that peak came from the initial pump trip or from this secondary collapse event. Profile animation is the tool that reveals the story.
Enabling Profile Animation
By default, HAMMER does not save animation data. The animation toolbar in the profile viewer will be greyed out:

To fix this, open your Calculation Options (double-click the blue options entry in the Scenarios panel), find Generate Animation Data, and set it to True. Recompute. Now the animation scrubber becomes active.
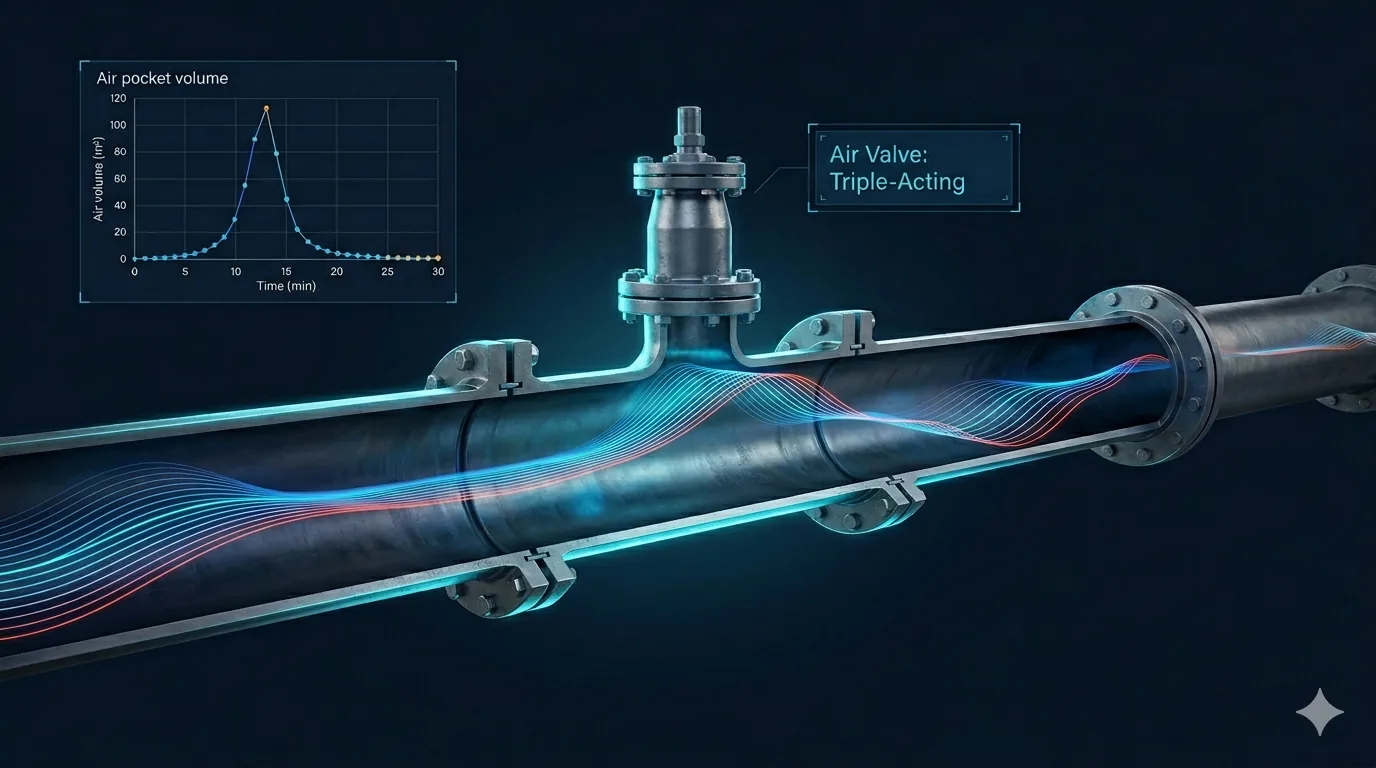
Advance to t = 3 s and play. You will see the hydraulic grade line move in real time. Watch the air/vapor volume panel at the top — air volume rises as the pocket forms, then drops as pressure returns and air is expelled. Pause the animation at the moment just before the air volume reaches zero. That is the collision point. The next frame shows the surge spike:

Improving Animation Smoothness
If the animation is jerky, the cause is the Report Times setting in Calculation Options. The default is Periodically with a report period of 10 (results saved every 10 time steps). Change this to At All Times so that every time step is saved. The animation will be far smoother — at the cost of a larger results file on very large models.
If you want smoothness and a large model, keep Report Times as Periodically but reduce the period to 1 or 2, or increase the animation frame rate. The animation speed can be changed via the small Options button in the profile toolbar (set frames per second to 20 for a fast, smooth playback).

The Fix: Triple-Acting Air Valve
The root cause is the outflow orifice size of the air valve. A double-acting air valve has two orifices: inflow and outflow, both fixed. If the outflow orifice is large, air is expelled fast — and collapse is violent.
A triple-acting air valve adds a transition volume. Air initially exits through a large outflow orifice (fast relief). But when the remaining air volume drops below a set threshold — say, 20 L — a float inside the valve partially closes the outflow orifice, throttling the final release. This cushions the collapse. The float mechanism is physically the reason you see a slight pressure pre-rise in the animation just before final expulsion — the partial closure is happening.

Comparing Double- vs Triple-Acting Side by Side
HAMMER can overlay multiple scenarios on the same time-history graph. Run both scenarios, then in the time-history viewer, use the Add Scenario button to add the second scenario before clicking Plot. Both pressure traces appear on the same axes:
- The double-acting trace shows an abrupt spike the moment air is fully expelled.
- The triple-acting trace shows a gradual pressure rise as the float closes, followed by a much lower collapse peak.

Q2 — Why Do I See a Big Surge When No Air or Vapor Pocket Shows in the Profile?
A user notices a large pressure spike in the profile animation. They look at the air/vapor volume panel at the top of the chart — it shows zero. No pocket. They have no explanation for the surge.
The cause is almost always the same: the air valve is connected at a T-branch (lateral pipe), not directly on the main line.
Why the lateral geometry hides the pocket
Some engineers connect air valves via a short lateral pipe, creating a T-junction rather than placing the valve directly in series on the main. This is done to simplify scenario switching — when comparing "no protection" vs "with air valve," the main pipes P3 and P4 stay active in both scenarios, and only the lateral pipe and air valve are toggled.
The problem is the profile. The default profile path follows the main line — P3, then P4. It does not traverse the lateral branch. Air that enters the valve exists at the branch node, not on the profile path. So the volume panel shows zero, even though a real pocket is forming and collapsing:

How to diagnose it
Switch to the time-history view and graph the pipe adjacent to the air valve (e.g. P57-AV). Plot both pressure and air/vapor volume for that pipe. You will immediately see:
- Air volume rises, peaks, then drops to zero.
- At the exact moment it reaches zero — the pressure trace spikes.

This makes the mechanism obvious: air pocket collapse at the T-branch causes the surge, even though it is invisible in the profile.
Q3 — Why Doesn't the Air Volume Graph Match the Max Air Volume Result?
An engineer looks at the profile and sees that the maximum air volume at the valve location reaches ~75 L. They then open the time-history graph for the upstream pipe adjacent to the air valve — and it only shows 68 L. They open the downstream side — it shows 22 L. Neither matches the 75 L they saw in the profile or in the element's statistical results panel.
Why the numbers differ
HAMMER tracks air pockets independently on each side of the air valve. When a pump check valve closes, the water column on the upstream side may stop moving immediately, while the downstream water column continues to move away from the valve. Air can accumulate simultaneously on both sides, with the pocket boundaries tracked separately by the solver.
The time-history at P3-AV upstream end shows only the upstream pocket volume. The time-history at P4-AV downstream end shows only the downstream pocket volume. Neither shows the total:

The fix: Extended Node Data
Extended Node Data for the air valve element reports the total volume — the sum of both sides — because it reads from the node itself, not from adjacent pipe endpoints. When you graph air volume here, the peak matches the statistical result (~70–75 L):

Q4 — Why Aren't My Air Valves Preventing Negative Pressure?
An engineer places several air valves along a transmission main. Pump trips. The transient simulation still shows sub-atmospheric pressures or column separation — apparently ignoring the valves. The instinct is to add more air valves, or larger ones. Sometimes this helps. Often it does not.
The real cause is a geometry and timing problem: the pressure drop wave reaches the uphill pipe section before it reaches the air valve.
How the wavefront outruns the valve
The pump trip creates a negative pressure wave that travels downstream at the wave speed a. If the pipeline rises sharply between the pump and the air valve location, the wavefront may cause pressures at those uphill nodes to drop below atmospheric — before the wave even reaches the valve:

The air valve only protects at its own location. It cannot send air backward along the pipe to fill a vacuum that formed upstream of it.
What to do
- Do not rely on air valves alone for systems with steep uphill sections downstream of pumps. Air valves are local protection devices — they protect the immediate vicinity of the valve location only.
- Combine air valves with a hydropneumatic surge vessel at the pump discharge. The vessel supplies pressurised water into the downsurge wavefront, raising the minimum pressure everywhere downstream — including the steep section.
- Consider a flywheel on the pump motor to extend the deceleration time and reduce the initial pressure drop rate.
- Review air valve placement: if the uphill section is isolated by high points, air valves on both sides of the uphill zone may be needed.
Q5 — Why Do I See Flow Even Though a Valve Is Closed?
A check valve closes on the pump. The time-history at the pump discharge pipe shows flow dropping to zero and staying there — as expected. But a time-history at a pipe further downstream shows flow going negative, then positive, then oscillating. How can water be moving in a closed system?
The cause: column separation creates separated water masses
When air enters the system (or when the pressure drops below vapour pressure and column separation occurs), the continuous water column is broken into separated segments. These segments can move independently of each other:
- When the air pocket is growing (low pressure phase), the downstream water column moves away from the valve — this shows as positive flow moving downstream.
- When the air pocket is collapsing (pressure recovery), the downstream water column moves toward the valve — this shows as negative flow (reverse direction).
The check valve is closed, and flow at the pump is correctly zero. But the check valve only isolates the pump side. The downstream water column, beyond the air pocket, is free to move — driven by the pressure differential created by the collapsing pocket.

Seeing it in sync
HAMMER allows you to open the profile animation and a time-history graph side by side. As you scrub the animation, both update simultaneously. With this view, the mechanism becomes self-evident: at the moment the flow graph shows the reversal, the profile animation shows the air volume panel beginning to drop — the pocket is collapsing and pulling the downstream column back toward it:

Bonus — The Extended CAV Option
A lesser-known HAMMER capability related to air valves is the Run Extended CAV option in Calculation Options. When enabled, HAMMER tracks the physical movement of the air pocket within the two pipes adjacent to the air valve — not just the total volume at the node.
Requirements: the air valve node must be at a higher elevation than the adjacent nodes, and the option only tracks movement in those two immediately adjacent pipes (not further downstream).

In practice, for most transmission main analyses, the impact of pocket migration on the overall transient results is small. But for detailed studies of pump restart dynamics or when the pocket is large relative to the pipe segment, Extended CAV provides a more physically accurate picture of what is happening at the valve location.
Setup Checklist Before Running a Transient Simulation
| Setting | Location in HAMMER | Recommended Value | Why |
|---|---|---|---|
| Generate Animation Data | Calculation Options → Transient Solver | True | Enables the animation scrubber — essential for diagnosing surge events |
| Report Times | Calculation Options → Reporting | At All Times (or period = 1–5) | Smooth animation; captures fast transient peaks |
| Report Period (surge devices) | Element properties → Report Period | 1 or 10 | Required for Extended Node Data — zero means no data saved |
| Detail Profile | View → Profiles → New | Create one near complex areas | Zoom in on check valve slam, air pocket collapse, pump station detail |
| Run Extended CAV | Calculation Options | True if air pocket migration matters | Tracks pocket movement in adjacent pipes |
Interactive: Air Pocket Collapse Pressure — Double vs Triple Acting
The chart below illustrates the core mechanism of Q1 — how air outflow orifice size controls the pressure spike at the moment of air pocket collapse. Toggle between the scenarios to compare pump discharge pressure over time.
Key Takeaways
- Always enable Generate Animation Data before computing — without it, you can only see the min/max envelope, not how the results were reached.
- Air valves can make results worse if the outflow orifice is too large. Air pocket collapse creates a secondary surge. A triple-acting valve with a transition volume cushions this.
- If a big surge appears with no air/vapor pocket in the profile, the air valve is probably on a lateral branch — use time-history on the adjacent pipe to find the pocket.
- Max air volume from a pipe endpoint time-history will be lower than the statistical result. Use Extended Node Data to see the total volume at the valve node.
- Air valves only protect their immediate vicinity. If the negative pressure wavefront reaches an uphill section before the wave reaches the valve, the valve cannot prevent it. Combine with a surge vessel or flywheel for upstream protection.
- Oscillating flow downstream of a closed check valve is not a model error — it is column separation. Separated water masses on either side of an air or vapour pocket move independently.
Source
This article is based on the Bentley Systems webinar "Take Control of Hydraulic Surges — Tips for Transient Analysis with OpenFlows HAMMER" by Jesse Dringoli (Principal Technical Support Engineer, Bentley Systems) and Julio Issao Kuwajima. Recorded March 25, 2026. All screenshots are taken directly from the webinar demonstration.