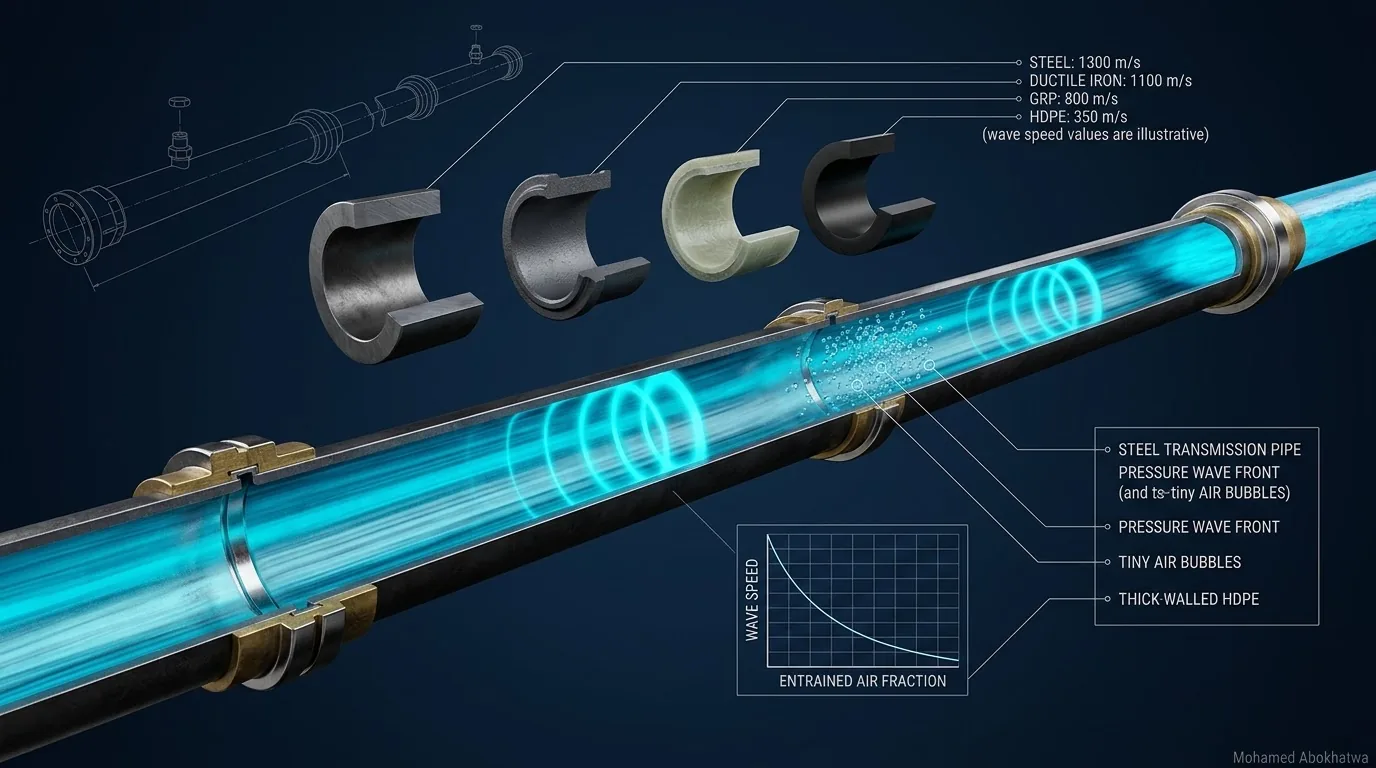
Every surge model of a pumping main starts with one number typed into every pipe: the wave speed. It sets the Joukowsky head, the 2L/a clock and whether the water column separates. On a 12 km DN800 ductile iron main, taking it from 1,050 down to 700 m/s cuts the Joukowsky head from 149.1 to 99.4 m and the unprotected peak from 165–190 m to 140–150 m. Yet the air-over-water vessel that holds the line above +3.0 m only moves from 3.08 to 3.19 m³ of gas. This article explains why, where that stops being true, and how to choose and test the number.
1 · Why wave speed is the first input
When pumps with little inertia trip, the flow at the pump stops almost at once. The pressure change that follows travels along the main at the wave speed \(a\), and both its size and its timing follow directly from that speed [1, 2, 5, 8]:
The Joukowsky head \(\Delta H\) applies when the velocity changes faster than a wave can reach the far end and come back. That round trip, \(2L/a\), is the clock that every valve closure, pump rundown and relief-valve opening is judged against [3].
The reference main for this series is 12 km of DN800 ductile iron K9 carrying 0.70 m³/s (2,520 m³/h) at 1.39 m/s, with the HGL at 85.0 m at the pump and 44.8 m at the delivery reservoir. It is PN16 with 136 m allowable, and the design minimum is +3.0 m. With a = 1,050 m/s:
- The Joukowsky head is 149.1 m (1,050 × 1.393 / 9.81, with the unrounded velocity). The pump end has only 85.0 + 9.8 = 94.8 m of head above vapour, so an instant stop takes it straight to vapour.
- 2L/a is 22.9 s: the time before anything at the reservoir end can affect the pump.
- The peak is 165–190 m. Once the column has separated, the peak comes from the cavity closing, not from Joukowsky, and it is above PN16 in either cavity model.
2 · What sets it: the water, the wall and the restraint
Wave speed is a balance between how much the water compresses and how much the pipe wall stretches. For a thin-walled elastic pipe, the Korteweg formula with the Wylie & Streeter restraint factor is [1, 2]:
Here \(K\) = 2.19 GPa is the bulk modulus of water, \(\rho\) = 998 kg/m³, \(D\) the diameter (the nominal diameter here, which for PE is the outside diameter, so D/e is the SDR), \(e\) the wall thickness and \(E\) the Young’s modulus of the wall. The restraint factor \(c_1\) depends on how the pipe is held along its length and on its Poisson’s ratio \(\mu\):
- Anchored at the upstream end only: \(1-\mu/2\).
- Anchored throughout against axial movement: \(1-\mu^2\).
- Expansion joints throughout: 1.
On its own, \(\sqrt{K/\rho}\) = 1,481 m/s is the speed of sound in water, which no pipe can exceed. The wall term \(KD/(Ee)\) compares how much the pipe stretches with how much the water compresses. It is 0.88 for DN800 ductile iron, where the two share the job, and 33.8 for PE100 SDR17 of the same size, where the wall does nearly all of it.
Worked example: the DN800 K9 pipe
ISO 2531 gives the nominal wall of a K-class ductile iron pipe as \(e = k\,(0.5 + 0.001\,DN)\) mm, with \(k\) the class number [14]. DN800 K9 therefore has e = 9 × 1.3 = 11.7 mm (D/e = 68.4). With E = 170 GPa and μ = 0.28:
| Restraint condition | c₁ | a (m/s) | Above 1,050 m/s by |
|---|---|---|---|
| Anchored at the upstream end only | 0.860 | 1,117 | 6.4 % |
| Anchored throughout | 0.922 | 1,101 | 4.8 % |
| Expansion joints throughout | 1.000 | 1,080 | 2.9 % |
The series uses a = 1,050 m/s, 3–6 % below these values. That choice is design judgement, not a formula result: an allowance for traces of air and for the joints, which the thin-wall formula does not see. Also in our judgement, socket-and-spigot ductile iron is closest to the expansion-joint case, and buried welded steel to anchored throughout.
3 · Interactive: wave speed calculator
Choose a pipe, then change its geometry, modulus and restraint. The curves show Korteweg wave speed against D/e for the current material under all three restraint conditions. The marker is your pipe.
The default, DN800 K9 with expansion joints, gives 1,080 m/s, a Joukowsky head of 153.3 m and 2L/a of 22.2 s, which is 2.9 % above the design value. Steel DN800 gives 1,094 m/s: the higher modulus is mostly cancelled by the thinner wall. HDPE PE100 SDR17 gives 251 m/s, a Joukowsky head of 35.6 m and a 95.6 s round trip. For the metals, a 10 % error in E moves a by about 2.5 %. For PE and GRP the same error moves it by about 5 %, because a then varies almost as \(\sqrt{E}\), and in our experience a plastic’s modulus is seldom known that closely.
4 · Materials, and where the numbers come from
| Pipe | E (GPa) | μ | D (mm) | e (mm) | Anchored upstream (m/s) | Anchored throughout (m/s) | Expansion joints (m/s) |
|---|---|---|---|---|---|---|---|
| Ductile iron DN800 K9 | 170 | 0.28 | 800 | 11.7 | 1,117 | 1,101 | 1,080 |
| Steel DN800 | 210 | 0.30 | 800 | 10 | 1,133 | 1,117 | 1,094 |
| Steel DN2000 | 210 | 0.30 | 2,000 | 20 | 1,079 | 1,061 | 1,036 |
| GRP DN800 | 11 | 0.25 | 800 | 16 | 475 | 461 | 448 |
| HDPE PE100 DN800 SDR17 | 1.1 | 0.45 | 800 | 47.1 | 284 | 280 | 251 |
| PVC DN300 | 3.0 | 0.40 | 300 | 11.7 | 371 | 362 | 334 |
- Ductile iron. The wall comes from the ISO 2531 K-class rule [14], and the modulus is well known. The cement-mortar lining adds some stiffness the formula ignores. In our judgement it is not worth taking credit for.
- Steel. D/e is what matters. DN2000 with a 20 mm wall gives 1,061 m/s anchored throughout, against 1,117 m/s for DN800 with a 10 mm wall. AWWA M11 covers surge in steel pipe design [11].
- GRP. The hoop modulus depends on the laminate, so the 11 GPa here is only an illustration. Use the manufacturer’s value for the actual pipe [12].
- PE and PVC. Use the short-term modulus, because a surge lasts seconds. The modulus falls as temperature rises, so the same line has a lower wave speed in summer. SDR17 pipe (D/e = 17) is thicker than the thin-wall formula strictly covers; restraint factors for thick-walled pipe are in [1, 2]. The diameter convention matters too: with the bore (705.8 mm) instead of the outside diameter, the same pipe gives 267 rather than 251 m/s with expansion joints, so state which you used. Wall thicknesses follow ISO 4427-2 and ISO 1452-2 [14], and AWWA M55 covers surge in PE pipe [13].
- Mixed or encased lines. A concrete surround, a sleeve, or a PE section inside a ductile iron main changes the wave speed locally. Model each section as its own pipe. An averaged value hides the reflections at each change.
5 · Air: the largest uncertainty
The Korteweg formula assumes water with no free gas in it. Real mains carry some: air released from solution as the pressure falls, air drawn in at the pump suction, and air let in by air valves during the downsurge [15]. The simplified isothermal form given by Wylie & Streeter [1] uses \(a_0\) for the wave speed without air, \(\alpha\) for the volume fraction of free gas at the local absolute pressure \(p\), and \(n\) for the gas exponent:
The gas term is divided by the pressure, so free air has its biggest effect at low pressure, which is exactly where the downsurge happens [2, 6]. A fixed quantity of gas also expands as the pressure falls (isothermally, \(\alpha\,p\) stays constant), so the effect at low pressure is stronger still. The table holds \(\alpha\) at the stated pressure:
| Free air by volume | 2 bar abs | 5 bar abs | 10 bar abs |
|---|---|---|---|
| 0.1 % | 412 | 587 | 725 |
| 0.5 % | 197 | 303 | 412 |
| 1 % | 140 | 219 | 303 |
| 2 % | 100 | 157 | 219 |
One-tenth of one per cent of free air at 2 bar abs takes away 61 % of the wave speed. Compressed to 10 bar abs, the same gas is only 0.02 % of the volume and the wave speed recovers to about 950 m/s, which is why the high-pressure part of a transient travels close to the pipe’s own wave speed. Carried the other way, 0.1 % at the steady 9.35 bar abs at the pump becomes about 0.7 % at the +3.0 m limit, where the wave speed is about 134 m/s. The low-pressure phase, which is the one a surge vessel exists to control, may travel far more slowly, and it is the part of the model we know least about [3]. How air valves let air into a line is covered in air admission in networks.
6 · Interactive: free air and pressure
Set the free-air fraction, the wave speed without air and the gas exponent. The red curve is your case. The faint curves show 0.1, 0.5, 1 and 2 % air at the same a₀ and n.
With 0.1 % free air and a₀ = 1,050 m/s, the curve gives 412, 587 and 725 m/s at 2, 5 and 10 bar abs, and 342 m/s at the +3.0 m limit with the same α. The next readout follows a fixed quantity of gas instead: 0.1 % at the steady 9.35 bar abs leaves only 134 m/s at the limit. Raising n to 1.2 only lifts the 2 bar value to 444 m/s; cutting the air to 0.01 % brings it back to 843 m/s.
7 · What wave speed does to the surge on a 12 km main
To isolate its effect, we ran the reference main at five wave speeds (1,300, 1,050, 700, 450 and 300 m/s) and changed nothing else: same bore, friction and HGL, all pumps stopping instantly with the check valve closing at once, and no protection. The low values are a sensitivity test on this main, not a model of a plastic line, which would have its own bore, friction and rating. The vessel columns give the smallest air-over-water vessel at the pump, with a free DN400 connection (K 0.5), that keeps the whole line at or above +3.0 m. The shell is the gas at maximum expansion divided by 0.8, a 20 % water reserve.
| a (m/s) | Joukowsky (m) | 2L/a (s) | Unprotected minimum | Unprotected peak, both cavity models | Gas at steady HGL (m³) | Gas at maximum expansion (m³) | Shell (m³) |
|---|---|---|---|---|---|---|---|
| 1,300 | 184.5 | 18.5 | −9.8 m (vapour) | 190–210 m | 3.11 | 16.00 | 20.0 |
| 1,050 | 149.1 | 22.9 | −9.8 m (vapour) | 165–190 m | 3.08 | 15.30 | 19.1 |
| 700 | 99.4 | 34.3 | −9.8 m (vapour) | 140–150 m | 3.19 | 15.32 | 19.1 |
| 450 | 63.9 | 53.3 | −9.8 m (vapour) | 85–90 m | 1.99 | 10.15 | 12.7 |
| 300 | 42.6 | 80.0 | +5.0 m (no separation) | 85 m (steady; no upsurge) | not needed | – | – |
The runs use a method-of-characteristics model with a vapour cavity model (120 reaches, 150 s), cross-checked with a gas cavity model and an independent second code [1, 4, 7]. They are not Bentley HAMMER results; a project analysis must be run in HAMMER, or an equivalent, on the real profile. What they show reliably is the trend.
Joukowsky is not the peak once the column separates
At 1,050 m/s the Joukowsky head is 149.1 m but the peak is 165–190 m. The pump end drops to vapour and a cavity opens, which in the model stays open for about 47 s, roughly two round trips. When returning water closes it, the collapse spike adds to the returning wave. Peaks fall with wave speed, as the table shows, but none can be read from Joukowsky.
Why the peak is a range
The collapse spike depends on how the cavity is represented. Against the vapour cavity model, the gas cavity model [7] puts these peaks between 13 % lower and 10 % higher, and the collapse peaks across this series between 18 % lower and 10 % higher, so neither is simply conservative. The design answer is not to pick a model but to stop relying on the collapse peak: protect the downsurge so the column does not separate [10].
450 m/s: separation below the Joukowsky threshold
The Joukowsky head is 63.9 m, well under the 94.8 m available, yet the line reaches vapour. The trip drops the pump head to 21.1 m, and the head then keeps falling as the line drains toward the reservoir, reaching vapour after about 42 s, before the reflection returns at 53.3 s. The collapse adds little: 85–90 m against a steady 85.0 m.
300 m/s: no separation
The first drop takes the pump end to 42.4 m, as Joukowsky predicts, and the head then drains to +5.0 m just before the reflection arrives at 80.0 s. There is no separation and no upsurge, and +3.0 m is met without protection. Joukowsky’s separation test happens to give the right answer here, but its minimum is 37 m too high: the drain-down takes the pump end to +5.0 m, only 2 m above the criterion. Only the model shows that.
8 · Interactive: the surge at five wave speeds
Choose a wave speed and a location. The dark trace is the unprotected pressure head from the vapour cavity model. The faint dashed trace is the 1,050 m/s case at the same point. The peak readout covers both cavity models.
Step from 1,050 down to 700 m/s: the spikes and the peak readout shrink, while the gas readout barely moves. At 450 and 300 m/s the spikes go and the vessel shrinks or disappears. On the 6 km trace the peak is 150–160 m, against 165–190 m for the whole line. The 300 m/s run covers under two round trips; run on to 320 s, the pump head peaks at 70.6 m and never exceeds the steady 85.0 m.
9 · Why the vessel barely moves, and when it does
Worked example: the vessel at 1,050 m/s
The sizing criterion is the smallest gas volume, in a vessel at the pump with a free DN400 connection, that keeps the whole line at or above +3.0 m. The gas starts at 85.0 + 10.33 = 95.3 m abs (9.35 bar abs) and expands with n = 1.2:
The model gives 3.08 m³ of gas at the steady HGL, expanding to 15.30 m³ at 13.9 m abs (about +3.6 m gauge). The gas does not fall to +3.0 m itself: the governing minimum is along the line, 4.6 km from the pump in this run, not at the vessel. The vessel has delivered 12.2 m³ of water, and the shell is 15.30 / 0.8 = 19.1 m³. The method is in Sizing the Hydropneumatic Surge Vessel and Stephenson’s simple guide [9]. The site’s reference vessel (20 m³ shell, 3.5 m³ gas, differential DN400 connection with K 2 out and K 10 in) holds +4.3 m minimum and 119.2 m maximum; article 2 explains the orifice.
The column’s momentum does not depend on wave speed
Across the stiff range the water delivered hardly changes: 12.9 m³ at 1,300 m/s, 12.2 at 1,050 and 12.1 at 700, then 8.2 at 450. The vessel is feeding a slowing column, 6,032 m³ of water at 1.39 m/s, whose momentum is
The wave speed is not in it. What a changes on a stiff pipe is the pressure history along the line: the Joukowsky head, the timing and the collapse peaks in the table above.
What does change: the water stored in the line
Wave speed does set how much water the line stores per metre of head, in the stretch of the wall and the compression of the water:
C is 0.054 m³ per metre at 1,050 m/s and 0.658 m³/m at 300 m/s, 12.25 times more. A flexible pipe gives water back from its own wall as the pressure falls, feeding the column from inside the line. At 700 m/s storage is 2.25 times the 1,050 m/s value and the vessel does not move. At 450 m/s it is 5.44 times, and the gas drops 35 % to 1.99 m³. At 300 m/s the line needs no vessel. Treat this qualitatively: the head does not fall evenly along the line, so C times the head drop is not the water delivered.
- Steel and ductile iron: refine the wave speed for pressures, pipe class and timing, not for vessel volume. Here the gas varies by less than 4 % from 700 to 1,300 m/s, and 700 m/s needs the most.
- A plastic wave speed on a steel or ductile iron main is the dangerous mistake. At 450 m/s this main’s vessel comes out 35 % too small and the peak 85–90 m instead of 165–190 m.
- A steel wave speed on a plastic line is also wrong. It overstates the Joukowsky head and the peaks, but it shortens 2L/a, so a closure that is rapid on the real pipe looks slow. In our judgement, from the trend of these runs, it also overstates the vessel. Size a plastic line with its own wave speed and its own model.
10 · Interactive: vessel volume against line storage
Move the wave speed and choose which vessel quantity to plot. The blue points are the five model runs; the thin dashed segment down to zero at 300 m/s only joins two runs and is not a computed size. The dashed amber curve is \(gAL/a^2\), calculated at any wave speed.
Compare the two curves. Storage grows as 1/a², but across the steel and ductile iron range it stays small and the vessel line stays flat; the vessel only falls once storage has grown several times over, at 450 m/s and below. Switch to shell volume and the shape is the same.
11 · Design practice: choosing the wave speed and testing both sides
The wave speed in a design basis should be traceable back to its source. In our practice that means three steps:
- Calculate. Apply Korteweg with the actual wall class or SDR, the right modulus (short-term at the operating temperature for plastics, hoop modulus for GRP), and the restraint that matches how the pipe is jointed and laid.
- Reduce, and label it as judgement. Take a modest allowance for air and joints. For this main that gives 1,050 m/s.
- Test both sides. In our judgement, run a deliberately high and a deliberately low value as uniform sensitivity cases. For this main we used 1,300 m/s, about 16 % above the highest Korteweg value for DN800 K9 (1,117 m/s), and 700 m/s, two-thirds of the design value. One wave speed per pipe cannot reproduce the local slowdown that free air causes at low pressure (section 5), so the low run is a sensitivity test, not a model of the air. Do not go lower to size a vessel down: on this stiff main 450 m/s cuts the computed gas to 1.99 m³, 35 % short of what 1,050 m/s needs. For plastics, vary the modulus with temperature.
| Check | End that governs | On this main |
|---|---|---|
| Peak pressure and pipe class | High a | 190–210 m at 1,300 m/s; 165–190 m at 1,050 m/s |
| Joukowsky head for a fast stop or valve slam | High a | 184.5 m at 1,300 m/s; 149.1 m at 1,050 m/s |
| Maximum with a free-connection vessel in place | High a | 140.9 m at 1,300 m/s; 130.9 m at 1,050 m/s (each with the gas sized for that wave speed) |
| Vessel gas for the downsurge | Not consistent; check both | 3.19 m³ at 700, 3.11 at 1,300, 3.08 at 1,050 m/s |
| Whether a closure counts as rapid (shorter than 2L/a) | Low a (longer 2L/a) | 34.3 s at 700 m/s; 22.9 s at 1,050 m/s |
| Whether an unprotected line separates | Not settled by Joukowsky | Vapour at every wave speed down to 450 m/s |
The value that is conservative for peak pressure is not the one that is conservative for the downsurge, so no single “safe” wave speed exists. EN 805 includes surge in the maximum design pressure [16]: check the pipe class against the high-wave-speed envelope, collapse peaks as a range, and timing decisions at both ends; see check valve slam, control valve closure and surge scenarios in pumping stations.
12 · Setting it up in Bentley HAMMER
The order we work in on a pumping main [17]: set the wave speed deliberately, check what the program actually used, and run the high and low cases beside the design case.
- Split the line wherever the wave speed changes. Model from the Pump, with its Check Valve, to the delivery Reservoir, starting a new Pipe at every change of material, diameter, wall class or restraint.
- Use the Wave Speed Calculator on each Pipe. Enter the pipe material, wall thickness (11.7 mm for DN800 K9), Young’s modulus, Poisson’s ratio and the support/restraint condition, and check the result against a hand Korteweg value (1,080–1,117 m/s for DN800 K9).
- Enter the design value in the wave speed field (1,050 m/s here), record why, and use it on every Pipe of the same construction.
- Define the load case. On each Pump set a pump trip (shut down) at time zero, with pump and motor inertia, speed, the 4-quadrant characteristic curves and the check valve closure time or delay. No protection in the first run. The runs in this article stop the pumps instantly, which is the severe bound; with the real inertia HAMMER will show a milder first drop, so do not expect to reproduce the section 7 table.
- Set the transient run options. Run duration of several round trips (150 s is about 6.6 times 2L/a here). The time step is computed from the shortest pipe and the wave speeds. Set the wave speed adjustment tolerance, turn on vapour pressure / column separation, and choose the friction method.
- Check the adjusted wave speeds against those you entered, on every Pipe. Short station pipes are where large adjustments usually appear, or they force a very small time step. In our judgement, do not coarsen the time step or loosen the wave speed adjustment tolerance so far that the main line’s wave speed drifts by more than a few per cent.
- Read the envelopes. In the Transient Results Viewer, plot the profile (path) with maximum and minimum head envelopes, add time histories at the pump discharge and mid-line, and use the animation to see where cavities form and collapse. Check the minimum against +3.0 m and vapour, the maximum against 136 m. This reference main is flat; on a real profile, subtract the pipe elevation from the head (or plot pressure) before making those comparisons.
- Run the low and high wave speeds (700 and 1,300 m/s here), compare envelopes with the design run, and record which run governs each check.
- Be wary of collapse-governed maxima. Where the minimum sits at vapour, the maximum also depends on the column separation settings. Do not let the pipe class rest on it.
- Size the protection, then rerun the range. Add a Hydropneumatic Tank at the pump (initial gas volume, gas law exponent 1.2, inlet orifice diameter, minor loss coefficient, ratio of losses, tank volume). Size it at the design wave speed, then rerun at 700 and 1,300 m/s and confirm at each that the minimum envelope stays at or above +3.0 m, the maximum at or below 136 m, and the gas at maximum expansion leaves the intended water reserve; size to the governing run. Here the free-connection vessel sized at 1,050 m/s (3.08 m³) lets the line fall to +2.6 m at 700 m/s and +2.9 m at 1,300 m/s, so 700 m/s sets the gas (3.19 m³), and at 1,300 m/s a free connection lets the maximum reach 140.9 m even with 3.11 m³. The site’s reference vessel, with its differential connection, stays within both limits at all three wave speeds (minimum +3.9 to +4.3 m, maximum 98.5 to 128.6 m).
Field names differ slightly between HAMMER versions; follow the intent of each step. The wider sequence is in the HAMMER transient workflow and HAMMER transient tips.
13 · Design checklist
- Calculate a for every material with Korteweg: actual wall class or SDR, the right modulus, a stated restraint condition.
- Record the design value in the design basis, with the allowance below Korteweg labelled as judgement.
- Compare Joukowsky with the head above vapour. For a fast (low-inertia) stop, larger means expect separation; smaller proves nothing (this main separates at 450 m/s, and drains to +5.0 m at 300 m/s).
- Run a high and a low wave speed and record which governs the peak and which the vessel.
- Check the pipe class against the high-a envelope, with collapse-governed peaks as a range across both cavity models.
- Expect no vessel saving from refining a on steel or ductile iron, and recheck the vessel at both ends of the range: minimum, maximum and water reserve.
- Give every plastic line or section its own wave speed, and never put a plastic value on a steel or ductile iron main.
- Check timing against 2L/a at both ends: check valve closure, valve stroke, relief valve opening.
- Keep the line out of the low pressures where air valves open and gas comes out of solution; that is where a is least certain.
- In HAMMER, confirm the adjusted wave speeds and run for several round trips.
- Wave speed: the number that sets the surge
- The differential orifice: empty freely, refill slowly
- Bladder, diaphragm or air-over-water vessel
- One-way surge tanks at the knee
- Surge relief valves: what a valve at the pump can protect
- Pump inertia and the flywheel
- Choosing surge protection on one pipeline
References & standards
- Wylie, E.B. & Streeter, V.L. Fluid Transients in Systems. Prentice Hall, 1993 — Korteweg wave speed with restraint factors, wave speed with free gas, method of characteristics, vapour cavity model.
- Chaudhry, M.H. Applied Hydraulic Transients, 3rd ed. Springer, 2014 — wave speed in thin- and thick-walled pipe, free gas, Joukowsky head.
- Thorley, A.R.D. Fluid Transients in Pipeline Systems, 2nd ed. Professional Engineering Publishing, 2004 — pump trip transients, round-trip time, uncertainty of wave speed with entrained air.
- Larock, B.E., Jeppson, R.W. & Watters, G.Z. Hydraulics of Pipeline Systems. CRC Press, 2000 — method-of-characteristics implementation and pump boundaries.
- Parmakian, J. Waterhammer Analysis. Dover, 1963 — the Joukowsky relation and pump-trip waterhammer.
- Swaffield, J.A. & Boldy, A.P. Pressure Surge in Pipe and Duct Systems. Avebury Technical, 1993 — surge propagation and the effect of free air on wave speed.
- Bergant, A., Simpson, A.R. & Tijsseling, A.S. “Water hammer with column separation: a historical review.” Journal of Fluids and Structures, 22(2), 2006 — vapour and gas cavity models and the sensitivity of collapse pressures.
- Stephenson, D. Pipeline Design for Water Engineers, 3rd ed. Elsevier, 1989 — water hammer in pumping main design.
- Stephenson, D. “Simple guide for design of air vessels for water hammer protection of pumping lines.” Journal of Hydraulic Engineering (ASCE), 128(8), 2002 — air vessel sizing.
- Boulos, P.F., Karney, B.W., Wood, D.J. & Lingireddy, S. “Hydraulic transient guidelines for protecting water distribution systems.” Journal AWWA, 97(5), 2005 — transient analysis and protection practice.
- AWWA M11 Steel Pipe — A Guide for Design and Installation — surge in steel pipe design.
- AWWA M45 Fiberglass Pipe Design — surge in GRP pipe design.
- AWWA M55 PE Pipe — Design and Installation — surge in polyethylene pipe design.
- ISO 2531 Ductile iron pipes, fittings, accessories and their joints for water applications; ISO 4427-2 Polyethylene (PE) pipes for water supply; ISO 1452-2 PVC-U pipes for water supply — K-class and SDR wall thicknesses.
- AWWA M51 Air Valves: Air-Release, Air/Vacuum, and Combination — air admission during transients.
- EN 805 Water supply — Requirements for systems and components outside buildings — maximum design pressure including surge.
- Bentley Systems. OpenFlows HAMMER product documentation and help — Wave Speed Calculator, wave speed adjustment, column separation, Hydropneumatic Tank, Transient Results Viewer.