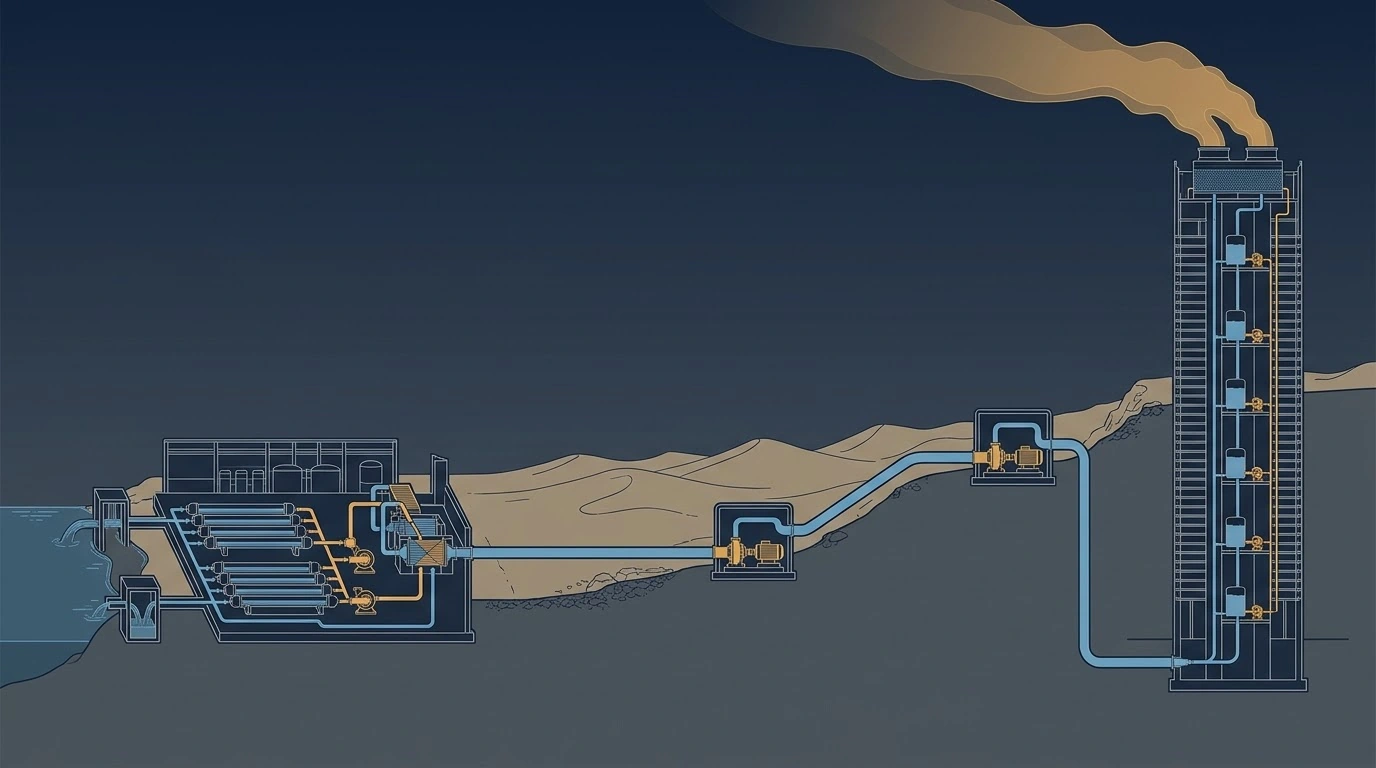
A litre of water arriving at a tap on the hundred-and-fiftieth floor of a Gulf tower has been made from seawater, pumped inland, and lifted six hundred metres. By the time it reaches the fixture it carries about six kilowatt-hours per cubic metre on the coast and ten inland — and the tower will evaporate several times that volume off its cooling towers without anyone recording the energy that went into making it. This is the accounting nobody does, because the desalination engineer stops at the plant fence and the building engineer starts at the site boundary.
1 · The chain nobody adds up
Every stage of this journey is well understood in isolation, and each has its own literature, its own specialists and its own conferences. What is missing is the sum.
- Desalination. A modern SWRO plant with pressure-exchanger energy recovery delivers permeate at roughly 3.5 kWh/m³. The same plant built in the 1990s, without recovery, took about ten.
- Transmission. On the coast this is almost free. Inland it is the largest single term in the whole chain, and it is invisible to everyone downstream of it.
- The building. Lifting to the top of a 600 m tower costs about 2.45 kWh/m³ at the pump shaft — pure physics, and the one term the MEP engineer actually controls.
- And then it is evaporated. A 50 MW heat-rejection plant drinks 2,400 m³ a day in makeup. That water carries the whole chain's energy with it, into the sky, as latent heat.
The reason this matters is not moral. It is that the four terms respond to completely different design decisions, they are not the same size in every city, and the cheapest term to fix is almost never the one being optimised.
2 · What a cubic metre costs to make
Reverse osmosis has to raise the feed above the osmotic pressure of seawater and hold it there. The ideal work is set by that pressure and the recovery ratio, and the real work is that divided by pump efficiency [1]:
with \(P\) the feed pressure in bar, \(R\) the recovery fraction, \(\eta\) the high-pressure pump efficiency and \(\varepsilon_{ERD}\) the effectiveness of the energy recovery device. The bracket is the whole story of the last thirty years: the brine leaves the membrane at almost full pressure, carrying \((1-R)\) of the feed with it, and a pressure exchanger hands that energy straight back to the incoming stream at around 96 % efficiency.
3 · Interactive: the specific energy of a litre, stage by stage
Set the plant, the transmission route and the tower. The bars are the four stages of the journey; the marker is the total the fixture actually receives. Then move the site from the coast to the interior and watch which term dominates.
At the default — a modern coastal plant, a short transmission route and a 600 m tower — the tap receives water at about 6.1 kWh/m³, of which the building itself is responsible for 2.45. Now drag the transmission head to 1,200 m, which is roughly what it takes to move water from the Gulf coast to the Riyadh plateau: the total becomes 10.1 kWh/m³ and transmission, not desalination, becomes the largest single term in the chain. Two conclusions follow immediately. In a coastal tower the building's own lift is the biggest thing the design team controls, and it is worth the zone-boosting argument that halves it. In an inland tower the building's lift is a detail, and every litre not used is worth far more than the pump energy suggests — which changes the economics of reuse completely.
4 · The part that is evaporated
The domestic water in a tower is the small stream. The large one is condenser water, and it does not leave through a drain — it leaves as vapour. The physics is fixed: rejecting a megawatt of heat by evaporation takes about 1.5 m³ of water an hour, because that is what the latent heat of vaporisation demands. Blowdown adds to it, at a rate set by how many times you are prepared to concentrate the dissolved solids before dumping them:
At four cycles of concentration a 50 MW plant needs 100 m³/h, or 2,400 m³ a day. In the Gulf that water is desalinated, because there is no other kind. The tower is therefore boiling desalinated seawater to keep itself cool, and the energy that made that water does not appear in any building energy model, any LEED calculation or any chiller efficiency comparison.
5 · Interactive: the evaporation ledger
This puts the two energies side by side: the electricity the chiller plant consumes, and the embodied energy of the water its cooling towers evaporate. They are not the same order of magnitude — but the second is not a rounding error either, and it is the one nobody counts.
On the coast the water a 50 MW plant evaporates carries embodied energy equal to about 8 % of what the chillers themselves consume. Move the same building to Riyadh and two things happen at once, in opposite directions: the water becomes more expensive to deliver, pushing the embodied term to roughly 14 %, while the drier air and lower wet bulb make the chillers more efficient, which raises the ratio further still. The inland tower has the cheaper cooling plant and the dearer water, and a design optimisation that sees only the electricity meter will get that trade exactly backwards. This is also the honest answer to a question people expect to be alarming: the embodied water energy is not larger than the chiller load, and anyone claiming otherwise is selling something. It is roughly a tenth of it — consistently, invisibly, and for the life of the building.
6 · Which levers actually move
Once the ledger is written down, the design responses sort themselves by size rather than by fashion.
- Cycles of concentration are free energy. Going from three cycles to six removes a quarter of the makeup volume for the cost of a better treatment programme and closer monitoring. No plant, no space, no capital. It is the highest-return water measure in the building and it is usually left to whoever holds the chemicals contract.
- Condensate is the highest-quality water in the building and it goes down the drain. A dedicated outdoor-air unit handling 10 m³/s in Gulf summer conditions strips about 16 m³ a day of distilled-grade water out of the air — produced at the point of use, on a high floor, with no chloride and no hardness. It is nearly ideal cooling-tower makeup and it needs no treatment beyond biocide.
- Greywater is a volume play, not a quality play. As the reuse arithmetic shows, a 2,000-person tower's greywater covers only about a tenth of a 50 MW plant's makeup — but it is the single largest recoverable stream, and in an inland city each cubic metre it displaces is worth ten kilowatt-hours rather than six.
- Dry and hybrid coolers trade water for energy, explicitly. They raise condensing temperature and chiller power in exchange for eliminating evaporation. With the embodied energy of water written down, that trade can finally be evaluated on one axis instead of two — and in an inland Gulf city it is much closer than the usual analysis suggests.
- Zone-boosting the domestic riser halves the building's own term, which matters most in exactly the place the other levers matter least: a coastal tower, where lift is the largest thing you control.
7 · Interactive: the recovery stack
Start with the makeup a plant needs and take it apart. Each measure removes a slice; what is left is the potable or treated-effluent water you actually have to buy, and the energy that came with it.
The stack is honest about proportions, and the proportions are the point. At the default, raising the cycles of concentration removes as much water as the entire greywater plant does — and it costs almost nothing in capital. Condensate is small in volume but disproportionately valuable: it is the only stream in the building that arrives cleaner than the mains supply, and capturing it well removes a treatment cost as well as a water cost. Greywater is the biggest recoverable volume and the biggest capital commitment. What remains after all three is still the majority of the bill — which is the realistic conclusion. Reuse does not make a Gulf tower water-neutral. It makes it about a fifth better, for a cost that is justified by the delivered energy behind every cubic metre rather than by the water tariff alone.
8 · What this changes on the drawing
- Put the delivered specific energy in the design basis, not the water tariff. In a subsidised market the tariff tells you nothing about the resource, and every reuse business case built on it collapses the moment the subsidy is revised. The energy figure is physical and survives.
- Design the condensate drainage as a collection system, not a disposal system. That is a decision about gradients, materials and a tank — taken at concept stage, worth nothing if retro-fitted, and impossible once the risers are set. It also removes the most common cause of ceiling damage in a finished tower.
- Specify cycles of concentration as a performance requirement with a monitoring obligation, rather than leaving it as an operational habit. Write the target, the conductivity set-point and the blowdown control method into the specification.
- Evaluate hybrid coolers on total energy, including the embodied energy of the water they save. Inland, that calculation is closer than the received wisdom.
- Tell the client the number. A megatall in an inland Gulf city consumes, through its cooling towers alone, the desalination output of a small town. That is a fact worth putting on one slide at concept stage, because it is the only moment when the architecture can still respond to it.
References & standards
- Voutchkov, N. Desalination Engineering: Planning and Design — specific energy consumption, recovery ratio and energy recovery device performance in seawater reverse osmosis.
- ASHRAE Handbook — HVAC Systems and Equipment, Cooling Towers chapter: evaporation rate, drift, blowdown and cycles of concentration.
- ASHRAE Handbook — Fundamentals, Psychrometrics chapter: moist-air properties used for the condensate calculation.
- International Desalination Association and Global Water Intelligence — published specific energy benchmarks for SWRO plants with and without pressure-exchanger energy recovery.
- Saline Water Conversion Corporation (SWCC) — Saudi water transmission system characteristics: coastal plants, inland pumping stages and delivered head to the central region.
- ASHRAE Design Guide for Tall, Supertall, and Megatall Building Systems, 2nd ed. — domestic water pumping energy and heat rejection strategy in tall buildings.
- Saudi Building Code SBC 501 / SBC 701 — mechanical and plumbing provisions, and Saudi Water Authority guidance on non-potable reuse for cooling tower makeup.