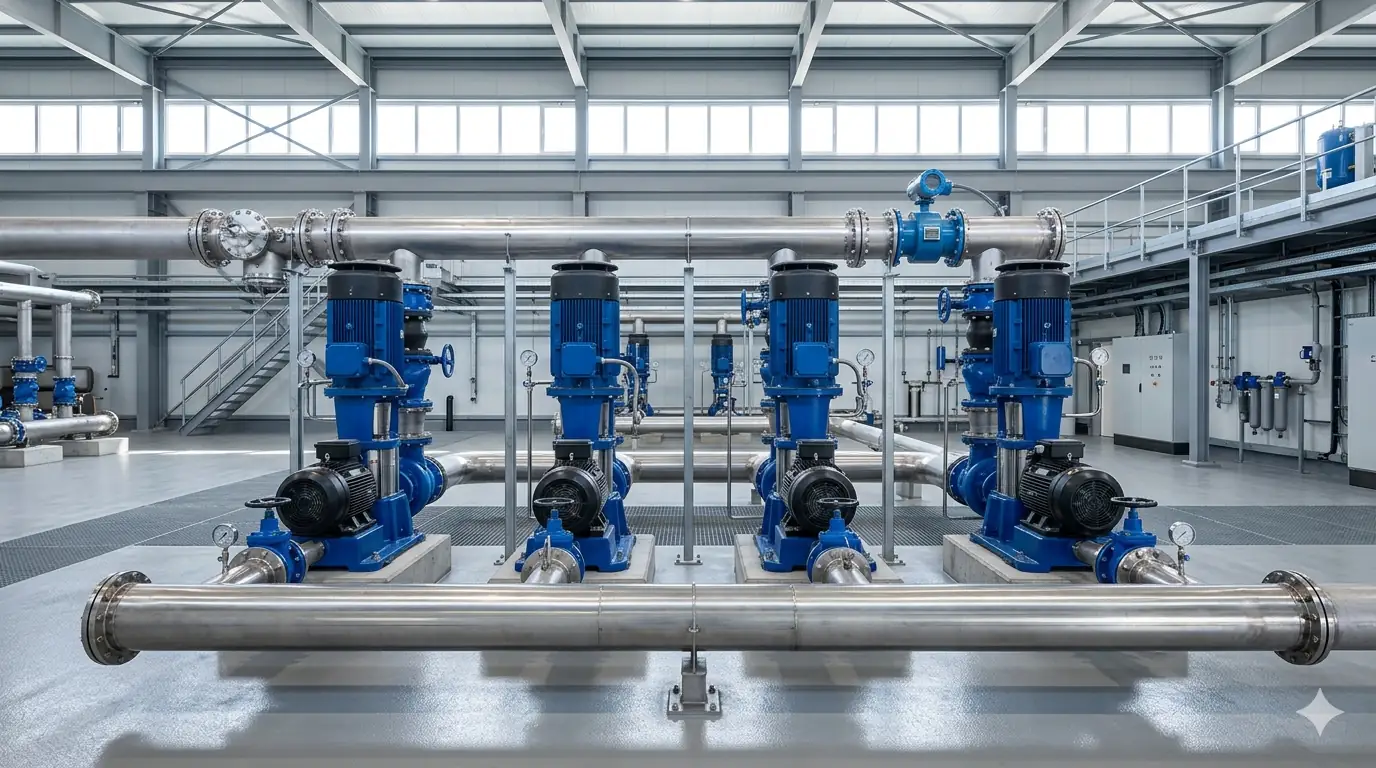
A pumping station is the one place in a water system where civil, mechanical and electrical engineering meet inside a single room — and the one most often designed as if it were a single pump bolted to a single motor. It is not. It is a fleet that must cover the busiest hour of the year with its largest machine switched off, follow a demand that swings five-fold across the day without short-cycling, and never let the pressure on its suction flanges fall low enough to boil the water it is moving. This is how that room is put together, and the three numbers that govern it.
1 · A station is a system, not a pump
The pump is the part everyone photographs. It is also the part least likely to fail the project. A large potable station fails — on paper at the design review, or at 7 a.m. in its third summer — for reasons that have nothing to do with the impeller and everything to do with how the machines are arranged, sequenced and fed:
- It is sized for redundancy, not just flow. The duty point tells you how much water; the firm capacity rule tells you how many machines, because the station must still deliver with one unit out for maintenance or failure.
- It must follow a moving target. Demand is not a number, it is a curve — almost flat at night, a wall at the morning peak. A bank of pumps that can only run flat-out either floods the storage or hammers itself to death cycling on and off.
- It lives or dies on its suction side. Discharge problems announce themselves; suction problems hide until the pump is cavitating, eroding and losing head. Where the pumps sit relative to the water surface is decided here, before the slab is poured.
- It is full of hardware that is not pumps. Check valves, isolation valves, the suction and discharge manifolds, flow meters, surge protection and the control logic are where most of the operating trouble actually lives.
2 · The layout — what the room actually contains
Walk a large potable station from the water in to the water out and you pass through a fixed sequence of parts. The two dominant arrangements differ in where the pumps sit relative to the water:
- The suction source — a clearwell, a ground reservoir or a suction header off a transmission main. For a station drawing from a wet well or sump, the intake geometry (approach channel, submergence, anti-vortex baffles) is a design discipline of its own[1].
- Dry-pit vs. wet-pit. In a dry-pit (dry-well) station the pumps stand in a dry gallery beside the water, fed through suction pipework — accessible, but they must be set low enough for positive suction. In a wet-pit arrangement vertical-turbine or submersible pumps hang directly in the water, buying suction conditions at the cost of access.
- The suction manifold — the common header feeding every pump, sized for a low velocity (typically ≤ 1.5 m/s) so that no single pump starves the next.
- The pumps and drivers — the duty + standby fleet, each with its own isolation valve, check valve and (increasingly) variable-frequency drive.
- The discharge manifold and metering — where the individual pump discharges combine, the flow is measured, and the station hands the water to the transmission main or distribution network.
- Surge protection — vessels, valves or tanks that absorb the transient when several pumps trip together (see surge scenarios in pump stations and surge vessels).
Everything downstream of this article — selection, surge, control — has its own treatment on this site. Here we build the skeleton: how many pumps, how they run, and how they are fed.
3 · From demand to the duty point
A potable station exists to move a known volume against a known head. The volume comes from the same demand basis that sizes the storage it usually feeds[2] — population \(P\) and per-capita demand \(q\) give the average, maximum and peak-hour demands:
Which of these sets the duty flow depends on what the station does. A transfer / high-lift station pumping into a storage reservoir is sized for the maximum-day rate over its pumping window — storage absorbs the hourly swing (the subject of strategic storage sizing). A distribution booster pumping straight into the network with little downstream storage must instead meet the peak-hour demand directly. The same town, two very different stations:
| Quantity | Value | Rate |
|---|---|---|
| Average-day demand (ADD) | 12,500 m³/d | 521 m³/h |
| Maximum-day demand (MDD), fd=1.5 — transfer duty | 18,750 m³/d | 781 m³/h |
| Peak-hour demand (PHD), fh=2.5 — booster duty | — | 1,302 m³/h |
The head is the total dynamic head the pump must overcome — the static lift between suction and discharge water surfaces plus all friction at the duty flow. Take a representative TDH of 60 m (45 m static lift + 15 m friction) for our transfer station at 781 m³/h. The hydraulic and shaft power follow directly[7]:
That 160 kW is the whole station's shaft power at full duty. The next decision — how to split it into machines — is where the station is really designed.
4 · How many pumps? Firm capacity and the N+1 rule
You never build one pump to do the whole duty. The single most important reliability rule in pumping-station design is firm capacity: the station must deliver its design flow with its largest unit out of service[4]. With \(N\) duty units and \(S\) standby units, each sized at \(q = Q_{duty}/N\):
The minimum that satisfies this is \(S=1\): one standby. That is the famous N+1 rule. Note what it does not say — it does not fix how many duty units you choose. That is a second, independent decision, and it trades two things against each other:
- The cost of redundancy. One standby out of \(N\) duty units is a redundancy premium of \(S/N\). Three duty pumps + one standby is a 33% premium; six + one is only 17%. More, smaller units make the spare cheaper.
- Granularity (turndown). With \(N\) equal fixed-speed units the smallest step you can deliver is one unit. More units means a finer staircase and a closer match to low night demand — fewer starts, less short-cycling.
Pulling the other way: more units means more valves, more pipework, more starters and more footprint. The right number is rarely one or two and rarely eight — for a station this size, three or four duty units plus one standby is the usual sweet spot. The first chart makes the trade visible.
5 · Interactive: the redundancy–granularity trade-off
Choose the station's full duty flow, the number of duty units and how much standby you carry. The bars show how big each machine must be at every candidate fleet size; the line shows the redundancy premium it carries. The highlighted bar is your choice — and the firm-capacity verdict warns you the moment the standby drops to zero.
Start at three duty units + one standby: each machine is a third of the duty, a 33% redundancy premium buys full firm capacity, and the bank turns down 3:1. Slide the standby to zero and the verdict turns red — the station now fails the moment any pump is touched. Raise the duty count to six and the units shrink, the premium falls toward 17% and the turndown sharpens to 6:1 — the classic argument for more, smaller machines, paid for in extra valves, starters and slab.
6 · Following the day — staging and the case for a VFD
A fleet of equal fixed-speed pumps can only deliver in lumps: one unit, two units, three. Real demand is a smooth curve. The controller closes the gap by staging — cutting a pump in when demand climbs past the capacity online, dropping one out when it falls. Between steps, the surplus has to go somewhere: into rising storage, or — if there is none — into a pump that switches on and off too often. Excessive starts are the quiet killer of motors, contactors and bearings; standards cap them at roughly 6–10 starts per hour for medium motors[8].
A variable-frequency drive on the lead pump dissolves the staircase. The base demand is carried by fixed-speed units; the lead pump's speed trims the remainder continuously, so the station's output tracks demand almost exactly. The affinity laws make this cheap at part load — power falls with roughly the cube of speed — which is why variable-speed pumping is now standard for anything with a wide demand swing[9] (with the caveats in the VFD myth, since a system with high static head does not enjoy the full cube-law saving). The second chart shows both regimes on the same day.
7 · Interactive: pump staging across the day
The blue area is the day's demand. The amber staircase is what a bank of equal fixed-speed pumps actually delivers as it stages up and down; the green line is the smooth output of the same bank with a VFD trimming the lead pump. Watch the gap between staircase and demand — that is the water a fixed-speed station must dump into storage, and the cycling it inflicts on itself.
With four fixed-speed units the night-time staircase over-pumps the network by a wide margin — every cubic metre of that surplus is short-cycling unless storage soaks it up. Switch the VFD on and the green line lies almost on the demand curve: the over-supply collapses, the cycling stops, and the part-load energy bill falls with it. Drop to two units and the steps grow so tall that even the storage struggles to absorb them.
8 · The suction side — NPSH, submergence and why pumps sit low
Everything so far is about the discharge side — flow and head out of the station. The failures that erode impellers and quietly steal head come from the suction side. A pump does not suck water; atmospheric pressure pushes it in. If the absolute pressure at the impeller eye falls to the water's vapour pressure, the water flashes to vapour, the bubbles collapse violently on the blades, and the pump cavitates — losing head, vibrating, and pitting metal. The margin against this is Net Positive Suction Head:
where \(H_s\) is the static head on the suction (positive when the water surface sits above the pump — flooded suction; negative for a suction lift) and \(H_f\) is the friction loss in the suction line. The pump supplies its own requirement, \(\text{NPSH}_r\), which rises steeply with flow and is fixed by the impeller. The design rule is simply that the available always beats the required, with a safety margin[2,3]:
Two terms in \(\text{NPSH}_a\) are brutal in a hot climate. The vapour-pressure term grows fast with temperature — water at 45 °C costs roughly a metre of head that 20 °C water does not — and the static term turns negative the moment the pump sits above its water source. This is the whole reason large pumps are set low, often below the suction water surface: every metre of flooded suction is a metre added straight to \(\text{NPSH}_a\). For the full derivation, the suction-lift versus flooded-suction cases and worked temperature corrections, see the dedicated guide on mastering NPSH in water infrastructure. The third chart lets you push these terms until the pump cavitates.
9 · Interactive: NPSH margin vs. flow
The blue curve is the head available at the impeller; the amber curve is what the pump demands, climbing with flow. Where blue stays above amber, the pump is safe; where they meet, it cavitates. The marker is your operating flow. Push the water temperature up or the suction level down and watch the safe margin close.
At a flooded suction of +2 m and 30 °C water the duty point carries a comfortable 7 m of margin. Now do what a tight site forces: drag the suction level negative to lift the water, and push the temperature to a summer 50 °C. The blue curve sinks, the margin closes, and somewhere on the way the marker falls into the red — the same pump, cavitating, because of where it sits and how warm the water is, not because of anything on its discharge flange.
10 · The hardware between the pumps
Most operating trouble in a station lives in the valves and fittings, not the impellers. The essential pieces, and what each is really for:
| Component | Role | What it prevents |
|---|---|---|
| Isolation valves (suction & discharge) | Take one unit out without draining the station | Shutting the whole station down to service one pump |
| Check valve (per pump) | Stop reverse flow when a pump stops | Backspin, and the slam transient on trip (sized/timed to the surge study) |
| Suction & discharge manifolds | Combine the units at low velocity | One pump starving another; manifold head loss eating duty head |
| Flow metering | Measure station output for control and accounting | Blind operation; no basis for staging or leak detection downstream |
| Surge protection | Absorb the transient on multi-pump trip | Column separation and pipe rupture (see surge scenarios) |
| Control & SCADA | Stage on demand / reservoir level; protect on fault | Short-cycling, dry running, dead-heading, run-out |
11 · Design & commissioning checklist
- Fix the duty first — decide transfer (MDD-rate into storage) vs. booster (PHD into network); the choice changes the flow by nearly a factor of two.
- Set the fleet by firm capacity — N duty + at least one standby, sized so the station meets duty with the largest unit out. Never accept a single-pump or N+0 station for potable supply.
- Choose the duty count deliberately — balance redundancy premium, turndown and footprint; three or four + one is usually right at this scale.
- Match the bank to the curve — verify the night turndown does not force more than ~6–10 starts/hour; add a VFD lead where the swing is wide or storage is thin.
- Check NPSH at the worst case — highest water temperature, lowest suction level, highest flow (run-out), with the required safety margin. Set the pump elevation from this, not from the architecture.
- Run the surge study before fixing check valves — the multi-pump power-failure trip sets the valve type, timing and the surge vessel (see surge scenarios).
- Specify duty rotation and protection — alternate the lead, and protect every unit against dry run, dead-head and run-out in the control logic.
- Witness the firm-capacity test at commissioning — prove the station meets design flow with one unit locked out, at the design head, before handover.
References & standards
- Hydraulic Institute. ANSI/HI 9.8 — Rotodynamic Pumps for Pump Intake Design — sump geometry, submergence and anti-vortex provisions.
- Hydraulic Institute. ANSI/HI 9.6.1 — Rotodynamic Pumps Guideline for NPSH Margin.
- Hydraulic Institute. ANSI/HI 9.6.3 — Rotodynamic Pumps Guideline for Allowable Operating Region.
- Great Lakes–Upper Mississippi River Board (GLUMRB). Recommended Standards for Water Works (Ten States Standards) — pumping-station firm capacity with the largest unit out of service.
- American Water Works Association. Manual M32 — Computer Modeling of Water Distribution Systems; AWWA G200 — Distribution Systems Operation and Management.
- Sanks, R.L. et al. Pumping Station Design. Butterworth-Heinemann — the standard reference on station layout and hydraulics.
- Karassik, I.J., Messina, J.P., Cooper, P., Heald, C.C. Pump Handbook. McGraw-Hill.
- U.S. EPA / NEMA. Motor starts-per-hour limits and pump-station control practice — short-cycling and motor protection.
- Hydraulic Institute & Europump. Variable Speed Pumping: A Guide to Successful Applications.