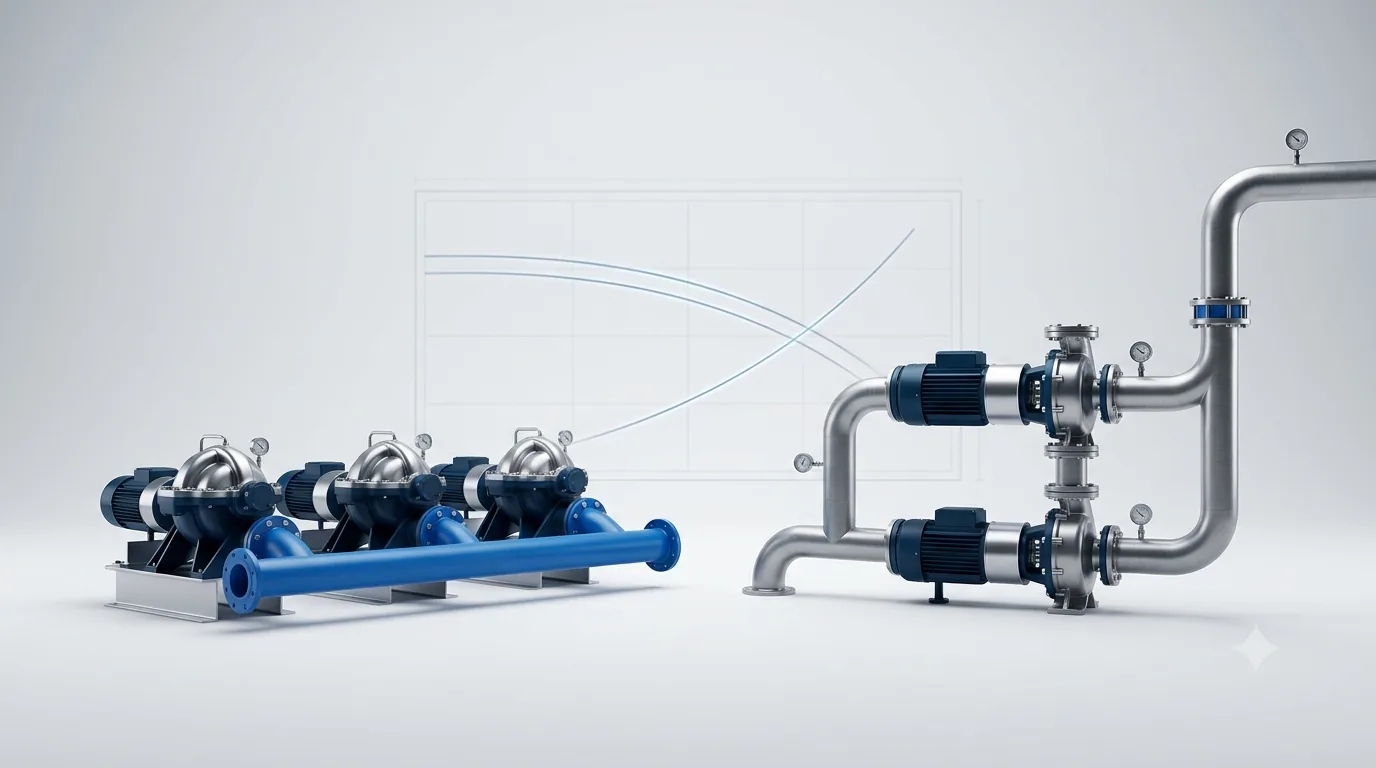
Why two pumps almost never give twice the flow, why a single pump sometimes gives no flow at all, and how the system curve quietly decides which configuration you actually need.
1 · Two ways to combine pumps
A single pump rarely covers the full operating envelope of a real station. Demand swings between night and peak, redundancy is mandatory, and sometimes one machine simply cannot produce the required head. The answer is to run pumps together — but how you combine them depends entirely on what you are short of: flow, or head.
The combination rules follow directly from the physics of a shared connection, and they are mirror images of each other:
| Configuration | Shared | Combine by | Construct the combined curve by… |
|---|---|---|---|
| Parallel (common header) | Same head across each pump | Adding flows | Summing \(Q\) horizontally at each head |
| Series (one feeds the next) | Same flow through each pump | Adding heads | Summing \(H\) vertically at each flow |
2 · Parallel operation — and the diminishing return
Parallel pumping is the default for water and wastewater stations: multiple identical units on a common suction manifold and a common discharge header, giving flow flexibility and built-in redundancy. The naïve expectation is that two pumps deliver twice the flow, three deliver three times, and so on. They do not — and understanding why is the single most important idea in this article.
When you add a second pump, total flow rises. But more flow through the same pipe means more friction, so the system curve drives the operating head up. At that higher head, each individual pump rides further back on its own H–Q curve and delivers less than it did alone. The combined output is the sum of these reduced contributions — always less than the simple multiple.
This is why parallel pumping and high-friction systems are a poor marriage, and why force-main and long-transmission stations must be checked carefully: the second and third units can add cost, energy, and wear while adding very little water.
3 · Interactive: parallel pumps on a system
Set N=2 and watch the “× vs single pump” figure: on the default system it lands near 1.4×, not 2×. Now drag the static head up (flatter system) and the multiple climbs toward 2; drag friction up (steeper system) and it collapses toward 1.
4 · Worked example — parallel station
Three identical pumps share a header discharging to a reservoir. Each pump curve is \(H = 60 - 8.0\times10^{-6}\,Q^2\) (Q per pump, m³/h), with BEP at 1,400 m³/h and η ≈ 82%. The system is \(H_{sys} = 30 + 4.0\times10^{-6}\,Q_{total}^2\). Solving the intersection for one, two and three running units:
| Units running | Total flow | Flow / pump | Duty head | % of BEP | η / pump | kW / pump | Specific energy |
|---|---|---|---|---|---|---|---|
| 1 pump | 1,581 m³/h | 1,581 | 40.0 m | 113% | 80% | 215 | 0.136 kWh/m³ |
| 2 pumps | 2,236 m³/h | 1,118 | 50.0 m | 80% | 78% | 196 | 0.176 kWh/m³ |
| 3 pumps | 2,488 m³/h | 829 | 54.5 m | 59% | 64% | 193 | 0.233 kWh/m³ |
Read across the table and the lesson is unmistakable:
- Two pumps deliver 1.41× the flow of one (2,236 vs 1,581), not 2×. The third pump adds only 252 m³/h — a 1.57× cumulative multiple for 3× the running plant.
- Each pump retreats toward shut-off as units are added: 1,581 → 1,118 → 829 m³/h. By the third unit, every pump runs at just 59% of BEP — below the POR, in the recirculation-prone zone flagged in the NPSH & low-flow article.
- Energy per cubic metre nearly doubles, from 0.136 to 0.233 kWh/m³, because the extra water is pushed against a higher friction head at lower efficiency. Adding pumps to chase flow on a friction-bound system is one of the most expensive habits in the industry.
5 · Stability & load sharing — where parallel goes wrong
Beyond efficiency, parallel operation introduces failure modes that simply do not exist for a single pump. Two deserve permanent residence in your design checklist.
Match the shut-off heads
Two dissimilar pumps in parallel only share load when the system head is below both of their shut-off heads. If the system head rises above the weaker pump's shut-off head, that pump delivers zero flow — its check valve slams shut and it churns liquid uselessly, heating up at near-deadhead. Worse, if the check valve leaks or fails, the stronger pump can drive flow backwards through it. Parallel pumps should be identical, or at minimum have closely matched shut-off heads.
Demand continuously-rising (stable) curves
A pump curve that is flat or drooping near shut-off creates the conditions for hunting: at one head, two flows are possible. Two such pumps in parallel can swap load unpredictably — one surges forward while the other backs off, then they reverse — producing pressure pulsation, vibration and check-valve hammer. Specify pumps with a head rise to shut-off (typically ≥ 10% above the BEP head) so that for every head there is exactly one stable flow.
6 · Series operation — when one pump cannot make the head
Series operation stacks heads: the discharge of the first pump becomes the suction of the second, and the same flow passes through both. It is the configuration for high-head, high-static duties — booster stations, long transmission lifts, high-rise supply — where a single machine simply cannot reach the required head no matter how far you throttle.
The decisive point: on a high-static system, a pump whose shut-off head is below the static head delivers nothing. It cannot even open the discharge against the standing column. No amount of parallel pumps helps — adding pumps in parallel never raises the maximum head. Only series (or a multistage pump, which is series stages in one casing) raises the head ceiling.
7 · Interactive: series pumps vs a high-static system
At the default 95 m static, the single-pump curve never reaches the system curve — “1 pump” reads a dash because it physically delivers no flow. Drag static below 60 m and it reappears.
8 · Worked example — series booster
A transmission lift requires 95 m of static head before any friction. Each available pump is the same unit as before, \(H = 60 - 8.0\times10^{-6}\,Q^2\) (shut-off 60 m). The transmission main gives \(H_{sys} = 95 + 5.0\times10^{-6}\,Q^2\).
| Configuration | Shut-off head | Reaches 95 m static? | Duty flow | Duty head |
|---|---|---|---|---|
| 1 pump | 60 m | No — below static | 0 m³/h | — |
| 2 in series | 120 m | Yes | 1,091 m³/h | 101 m |
| 3 in series | 180 m | Yes | 1,712 m³/h | 110 m |
A single pump produces no flow at all — its 60 m shut-off head cannot lift the 95 m static column. Two in series deliver 1,091 m³/h at 101 m total head (each pump contributing ~50.5 m), and a third stage raises both flow and head. This is the mirror image of the parallel case: on a high-static system, series adds capability where parallel adds nothing.
9 · Staging logic — duty, standby & assist
Real stations rarely run a fixed number of pumps. They stage units in and out to track demand, equalise wear, and preserve redundancy. Good staging design turns the curves above into a control philosophy.
Sizing for redundancy: the N+1 rule
Critical water and wastewater stations are built N+1: N pumps meet peak duty, plus one full standby so that peak flow is still met with the largest unit out of service for maintenance or failure. For high-criticality assets, N+2 or duty/standby pairs per stream are used. The standby is not a capacity unit — counting it as capacity is a classic and dangerous error.
Lead / lag / assist control
- Lead pump starts first and, if variable-speed, modulates to hold the setpoint (level or pressure).
- Lag / assist pumps cut in when the lead reaches maximum speed/flow and the setpoint still cannot be held — i.e. when the duty point would otherwise run off the end of the lead pump's curve.
- Alternation rotates the lead role between units (by run-hours or starts) so wear is shared and no single pump becomes the “always-on” unit.
The preferred modern architecture: one VFD lead + fixed-speed lags
A widely used and cost-effective scheme runs the lead pump on a variable-frequency drive for fine setpoint control and soft starting, while the assist pumps are fixed-speed and staged on/off. The VFD trims the combined output continuously between discrete pump steps, avoiding both throttling losses and the cost of a drive on every unit. Staging thresholds are set from the combined-curve / system-curve intersections so that each unit cuts in near its own efficient region — not deep in recirculation.
10 · Design checklist & engineering judgement
- Plot the combined curve against the real system curve for every running combination (1, 2, 3 … N) — never assume a flow multiple.
- Check each pump's % of BEP in every staging step. If adding a unit drives the others below POR, the configuration is wrong, not merely sub-optimal.
- For parallel: use identical units, demand continuously-rising curves (≥10% head rise to shut-off), and match shut-off heads to prevent load-sharing failure.
- For series: rate downstream casings and inter-stage pipe for the cumulative pressure, and confirm the lead pump satisfies NPSH alone.
- Confirm the head ceiling. If maximum static head approaches a single pump's shut-off, parallel cannot help — you need series or multistage.
- Size N+1 (minimum). Standby is not capacity. Document it explicitly so no one “borrows” the spare on the next flow study.
- Set staging thresholds from the curves, with hysteresis, anti-cycling timers, minimum-flow protection, and lead alternation for even wear.
References & standards
- Jones, G.M. (ed.). Pumping Station Design, 3rd ed. Butterworth-Heinemann, 2008 — the definitive reference for parallel/series staging and station hydraulics.
- Hydraulic Institute (HI). ANSI/HI 9.6.3 — Rotodynamic Pumps: Guideline for Operating Regions (POR / AOR).
- Hydraulic Institute (HI). ANSI/HI 1.3 — Rotodynamic (Centrifugal) Pumps for Design and Application.
- Hydraulic Institute (HI). ANSI/HI 9.6.1 — Rotodynamic Pumps: Guideline for NPSH Margin.
- Karassik, I.J., Messina, J.P., Cooper, P., Heald, C.C. Pump Handbook, 4th ed. McGraw-Hill, 2008.
- Gülich, J.F. Centrifugal Pumps, 4th ed. Springer, 2020 (curve stability, parallel hunting).
- U.S. DOE & Hydraulic Institute. Improving Pumping System Performance: A Sourcebook for Industry, 2nd ed.
- Europump & Hydraulic Institute. Pump Life Cycle Costs: A Guide to LCC Analysis for Pumping Systems.
- Flowserve / Cameron. Cameron Hydraulic Data Book, 19th ed. (combined-curve construction).