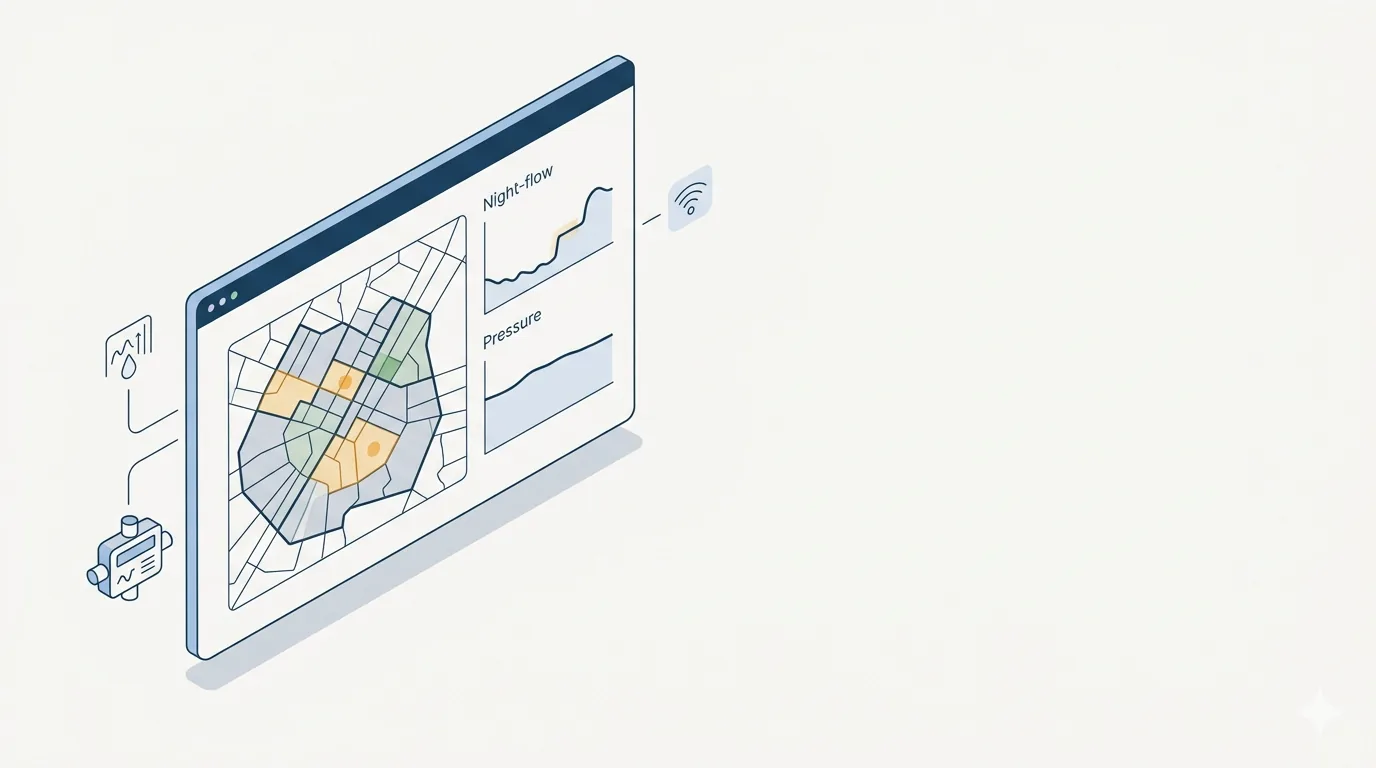
The previous two articles built the theory: divide the network into District Metered Areas, read the loss from minimum night flow, and account for every drop with the water balance and the ILI. But a water balance built once a year, by hand, is a post-mortem. To actually control Non-Revenue Water you need the loss measured every night, every DMA, automatically — and a system that turns that torrent of data into a short, ranked list of where to send a crew tomorrow morning. That system is a Water Management System (WMS) such as NETBASE, and this is how it works, end to end.
1 · From a yearly audit to a living network
Manual leakage control has a fatal latency. A burst that starts the day after your annual survey can run for months before anyone notices the bill. Smart NRW management closes that gap by instrumenting the network and letting software watch it continuously. The shift is from knowing how much you lost last year to knowing which zone started leaking last night. Three capabilities make that possible[1][2]:
- Permanent measurement. Flow and pressure loggers on every DMA inlet, reporting continuously instead of during an annual visit.
- Automated analysis. The WMS computes each DMA's night flow, converts it to a daily leakage volume, and compares it with that zone's own history — every day, for hundreds of zones at once.
- Exception-based action. Instead of reading every chart, engineers react to alarms: the zones whose loss has stepped up. The data does the watching; people do the fixing.
2 · The smart-water data chain
A WMS sits in the middle of a layered architecture. Each layer has a job, and the value of the system is only as good as the weakest one — bad data in, bad decisions out. Read it left to right: the field measures, communications carry, the WMS stores and analyses, and people and valves act — then the loop repeats[2][5].
The data sources differ in what they see and how often, and a good WMS fuses all of them onto one time-base:
| Source | What it gives | Typical interval |
|---|---|---|
| DMA inlet flow logger | Zone inflow → night flow, the core leakage signal | Log 15 min; send 1–24 h (or on alarm) |
| Pressure logger (AZP / critical point) | Average zone pressure, for the leakage–pressure correction | Log 1–15 min |
| SCADA / RTU (reservoirs, pumps, PRVs) | Levels, pump status, valve position | Near real-time |
| Customer meters / AMI | Billed consumption → apparent loss, legitimate night use | Daily–hourly |
| GIS | Mains length, connections, DMA boundaries, asset attributes | Static, periodically synced |
3 · Step one — acquisition and the unglamorous art of clean data
Every leakage figure the WMS ever produces rests on the quality of the raw signal, so the first job inside the software is data validation, not analysis. Loggers drop out, modems miss a call, a meter ices up, a clock drifts. Before night flow means anything, NETBASE-class platforms run each channel through validation, gap-filling and correction[3][5]:
- Time synchronisation. Every logger and SCADA tag must share one clock, or the night window will sample the wrong hour. Confirm the data is in the correct time zone and that daylight-saving shifts are handled.
- Unit and scaling check. Verify the meter's pulse weight / K-factor and engineering units (L/s vs m³/h vs Ml/d) at import; a wrong scale factor silently multiplies every result.
- Spike and flat-line removal. Reject physically impossible jumps and stuck values, and flag — don't silently invent — missing periods. Short gaps can be interpolated; long ones should be excluded so they cannot poison the night-flow average.
- DMA integrity. The single most common cause of a wrong night flow is a boundary valve that is supposed to be shut but is passing, or a second feed nobody logged. Periodic closed-valve / zero-pressure tests prove the zone is truly sealed.
4 · Step two — the night-flow engine
This is the analytical heart of the WMS, and it is worth understanding exactly what the software does between the raw inlet flow and the leakage number on the dashboard. It runs every DMA, every night[2][3][4].
4.1 Find the minimum night flow
Between roughly 02:00 and 04:00 legitimate demand bottoms out, so the inlet flow is dominated by leakage. The WMS picks the minimum sustained flow in that window — the minimum night flow (MNF).
4.2 Subtract legitimate night use
Not all of the MNF is loss. A residual of genuine night consumption remains — toilet cisterns, a few night-shift users, the occasional large customer. The standard estimate is an allowance per property plus any metered exceptional night users[3]:
where NNF is the net night flow (the leakage component at night), \(N_p\) the number of properties, and \(q_{\text{legit}}\) a per-property night allowance (a common default is ≈ 1.7 L/property/hour). Exceptional users (a hospital, a factory) are measured separately and removed explicitly, not averaged in.
4.3 Convert night leakage to a daily volume
Leakage at 3 a.m. is not the daily average leakage, because pressure is highest at night and — by the FAVAD law — leakage rises with pressure. To turn the net night flow into a daily volume you apply the Night-Day Factor (NDF): the number of "night-equivalent" hours in the day once you account for the lower daytime pressure[3][4]:
With constant pressure the NDF would be 24; because daytime pressure is lower, it is typically 20–22. This pressure correction is exactly why a co-located pressure logger matters: without it, the WMS over-states daily leakage by assuming night conditions all day.
5 · Interactive: nightly monitoring & the burst alarm
This is the view an engineer actually lives in: one DMA's minimum night flow, night after night. The WMS learns the zone's baseline and sets an alarm threshold above it; when a burst steps the night flow up across that line, the zone alarms and lands on tomorrow's work list. Set the background leakage, drop in a burst, and tune how sensitive the alarm is — then watch how fast it fires and how much water escapes before it does.
A 6 m³/h burst on a 10 m³/h baseline with a 3 m³/h threshold trips the alarm the very next night — days, not months, after it started. Now shrink the burst toward the threshold: it takes longer to stand out from the nightly scatter, and more water is lost before detection. Loosen the sensitivity too far and a real burst can hide in the noise; tighten it too far and ordinary variation cries wolf. Tuning that line per DMA is the daily craft of running a WMS.
6 · Interactive: how often you read the data decides how much you lose
Detecting a burst quickly is worth real water, and detection speed is capped by how often the loggers actually deliver data. A logger that records every 15 minutes but only dials home once a day cannot warn you any faster than once a day. This chart traces the water lost from the moment a burst starts until the WMS first sees it — for a traditional daily read versus the transmission interval you choose.
A 5 L/s burst loses 18 m³ every hour. Found on the next day's read, that is up to ~432 m³ gone; moved to a 6-hour delivery, ~108 m³; on 15-minute near-real-time telemetry, almost nothing. This is the business case for more frequent communications and event-driven alarming — and the reason "fast logging on alarm" modes exist on modern loggers. More data is not vanity; it is recovered water.
7 · Step three — closing the loop with pressure
Monitoring tells you where the loss is; the cheapest control acts on all of it at once. Because the WMS already holds each zone's flow and pressure, it is the natural place to drive pressure management. Modern PRV controllers accept a flow signal and modulate the outlet so the critical point sits at target for the actual demand — high at peak, low at night — and the WMS both supplies that flow signal and verifies the result by watching night flow fall[2][6]. The full mechanics — fixed, time- and flow-modulated control, and the FAVAD payback — are covered in pressure management & DMAs; here the point is that the same platform that detects the loss also commands the valve and confirms the saving, all on one set of data.
8 · Step four — deciding where to dig first
A city has hundreds of DMAs and a handful of leakage crews. The WMS turns the night-flow results into a ranked work list so the limited teams attack the zones with the most recoverable water first — the difference between current leakage and that zone's achievable level. It is a classic Pareto problem: a small number of DMAs usually hold most of the recoverable loss.
9 · Interactive: prioritising the crews
Twelve DMAs, ranked by recoverable leakage. You have only so many crews this cycle — drag the count and the WMS assigns them to the worst zones first. Watch how quickly the cumulative line climbs: tackling the top few zones captures the majority of the recoverable water, which is why ranking beats working the network in map order.
With four crews on the worst four of twelve zones you capture about 62% of all recoverable water — the Pareto pay-off. Adding crews five and six helps far less per crew: the curve flattens. The WMS makes this visible so management funds the crews that matter and stops spreading effort evenly across zones that barely leak.
10 · Don't forget apparent loss — AMI and the meter
Everything so far attacks real losses. The other half of NRW — apparent loss — lives in the same data platform. Advanced Metering Infrastructure (AMI) streams customer consumption into the WMS, which lets it: size the legitimate-night-use allowance from real night consumption instead of a default; flag stopped or under-registering meters by their profile; detect zero-consumption accounts that should not be zero; and tighten the water balance because billed volume is now measured continuously, not estimated. Real and apparent loss share one system of record[1][7].
11 · Inside the software — getting accurate results
The platform is only as good as how it is set up. The settings and habits that separate a trustworthy WMS deployment from a noisy one[3][5]:
- Prove the DMA before you trust the number. Run a closed-valve test on commissioning and periodically; an unlogged second feed or a passing boundary valve corrupts every night flow that follows.
- Set the night window deliberately. Confirm 02:00–04:00 is genuinely the local minimum for that zone; shift it for areas with unusual demand (industrial, irrigation, different time zone/culture).
- Calibrate legitimate night use, don't accept the default. Use AMI or a night-use study to set the per-property allowance and to list exceptional users explicitly; the 1.7 L/prop·h figure is a starting point, not gospel.
- Feed it real pressure for the NDF. Compute the night-day factor from a measured AZP profile, not an assumption — it directly scales the daily leakage volume.
- Tune alarm thresholds per DMA. Quiet residential zones tolerate tight thresholds; mixed-use zones need wider ones. Review false-alarm and missed-event rates and adjust — a blanket threshold fails everywhere at once.
- Check meter K-factors and units at every import. A single wrong scale factor is the most common silent error in the whole chain.
- Integrate GIS and the hydraulic model. Pull mains length and connection counts from GIS for UARL/ILI; export validated demands to the calibrated network model (EPANET, WaterGEMS, InfoWorks) so monitoring and modelling agree.
- Govern the data continuously. Watch logger battery and signal health, communication success rates, and gap statistics; a fleet of silent loggers is a dashboard of comforting lies.
12 · The implementation checklist
- Instrument the DMAs — flow at every inlet, pressure at AZP/critical point, with adequate logging and transmission frequency for your detection target.
- Establish the data backbone — reliable communications, a validated import into the WMS, one synchronised clock, correct units and K-factors.
- Configure the night-flow engine — night window, legitimate night use, exceptional users, and a measured NDF per zone.
- Set and tune alarms — per-DMA thresholds; review false/missed rates and adjust.
- Wire in pressure control — flow-modulated PRVs driven and verified by the platform.
- Prioritise and dispatch — rank by recoverable loss; send crews worst-first; track run-time to repair.
- Add AMI for apparent loss — calibrate night use, catch meter faults, tighten the balance.
- Integrate GIS and model — for ILI benchmarking and for keeping monitoring and the hydraulic model consistent.
- Govern and review — logger health, data completeness, and a monthly ILI/water-balance trend, not just a yearly number.
References & further reading
- American Water Works Association. Manual M36 — Water Audits and Loss Control Programs (water balance, NRW components, real vs apparent loss).
- Farley, M. & Trow, S. Losses in Water Distribution Networks: A Practitioner's Guide to Assessment, Monitoring and Control. IWA Publishing — DMA monitoring and night-flow analysis.
- UK Water Industry / WRc. Managing Leakage series — esp. Report E: Interpreting Measured Night Flows (net night flow, legitimate night use, hour-to-day / night-day factor).
- Lambert, A.O. & Morrison, J.A.E. Recent developments in pressure–leakage relationships and night-day factors. IWA Water Loss conferences (FAVAD / N1).
- Ovarro (formerly Servelec Technologies / Technolog). NETBASE Water Network Management Software — product and application documentation (DMA management, night-line analysis, alarms, pressure management, reporting).
- Thornton, J., Sturm, R. & Kunkel, G. Water Loss Control. McGraw-Hill — active leakage control, intervention and pressure management.
- IWA / smart-water references on AMI, telemetry and data validation for water utilities; AWWA standards for metering accuracy.
- EPANET (US EPA); Bentley OpenFlows WaterGEMS; Autodesk/Innovyze InfoWorks WS Pro — hydraulic model integration and demand calibration; Esri ArcGIS for GIS/asset data.