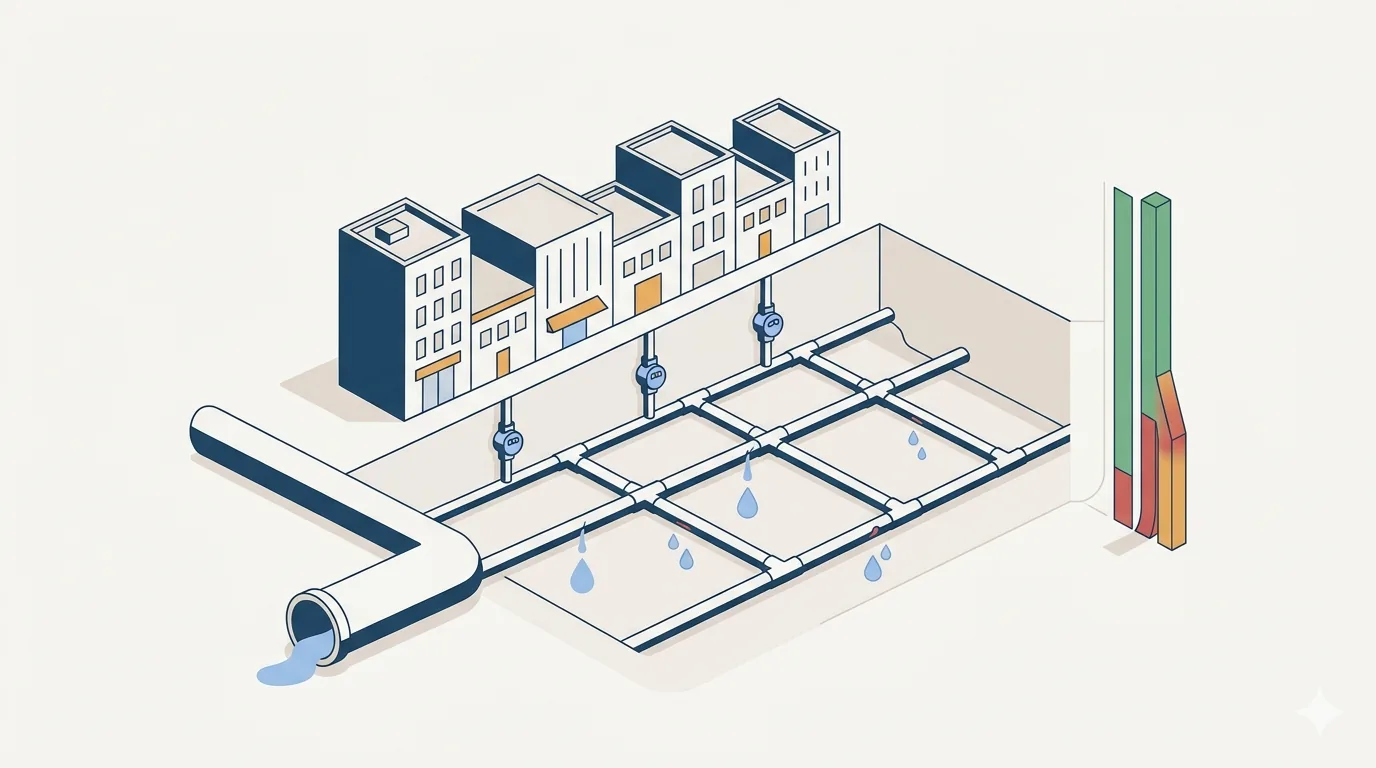
Every utility produces more water than it sells. The gap — the water that is pumped, treated and paid for but never billed — is Non-Revenue Water, and in many networks it is a quarter to a half of everything that enters the pipes. It is also the most misunderstood number in the business: managers quote a single percentage, boards set targets against it, and almost all of them are measuring the wrong thing. This is the discipline that fixes that — a standard way to account for every drop, an honest index of how leaky the network really is, and the economics that tell you when to stop chasing leaks.
1 · What Non-Revenue Water actually is
Non-Revenue Water (NRW) is simply the difference between the water a utility puts into its network — the system input volume — and the water it bills its customers for. It is tempting to read that as "leakage," but NRW is broader and more interesting than that. It is made of three very different things[1]:
- Real (physical) losses — water that physically escapes the system: background leakage from joints and fittings, reported bursts, and unreported leaks that run until found. This is the part you fix with valves, pressure and excavation.
- Apparent (commercial) losses — water that is delivered and used but never correctly billed: under-registering customer meters, data and billing errors, and unauthorised consumption (theft, illegal connections). The water reaches a tap; the revenue does not.
- Unbilled authorised consumption — water the utility legitimately gives away or uses itself: mains flushing, firefighting, public fountains, and genuinely unmetered legal use.
The reason the distinction matters is that the three have completely different cures and completely different costs. A litre of real loss costs only what it cost to produce and pump. A litre of apparent loss is far more expensive — it was treated, pumped and delivered, and it should have earned the full retail tariff, so you lose the margin too. Lumping them into one percentage hides exactly the information you need to act[2].
2 · The IWA water balance
The international standard for accounting water loss is the IWA / AWWA water balance[1][3]. It is a single bookkeeping table that starts from the system input volume and divides it, step by step, until every drop is in exactly one box. Read it left to right and two columns fall out the right-hand side: Revenue Water (what you billed) and Non-Revenue Water (everything else).
The balance is built top-down: you meter the system input, you total what you billed, and you estimate the smaller boxes (unbilled use, meter error, unauthorised use) so that the components add up. The single most valuable output is not the percentage — it is the split between real and apparent losses, because that tells you whether your money belongs in the field (finding leaks) or in the back office (fixing meters and billing).
3 · Interactive: build your water balance
Set the system input and the three loss components and watch the balance assemble. The green block is the revenue you actually collect; the grey, amber and red blocks together are Non-Revenue Water. Notice how a small slice of apparent loss can cost as much revenue as a much larger slice of real loss — because apparent loss is billed at the full tariff, not just production cost.
A 20,000 m³/d system at 18% real + 7% apparent + 3% unbilled is 28% NRW. Hold the volume and drag apparent loss up by a few points: the revenue value climbs far faster than the same change in real loss, because every apparent litre is priced at the retail tariff. That is why a leak-only programme can miss half the money.
4 · Real vs apparent — two problems, two cures
Because they cost differently and are fixed differently, the two loss families need separate programmes:
| Aspect | Real (physical) losses | Apparent (commercial) losses |
|---|---|---|
| Where the water goes | Into the ground — leaks & bursts | To a customer, unbilled |
| Unit cost | Variable production + pumping cost | Full retail tariff (lost revenue) |
| Driven by | Pressure, pipe age/material, repair speed | Meter age/sizing, data systems, theft |
| Found by | DMA night flow, acoustic survey, step tests | Meter testing, data audits, field inspection |
| Fixed by | Pressure management, ALC, pipe renewal | Meter replacement, billing reform, enforcement |
The real-loss programme is the engineering one, and it leans directly on the two previous articles: pressure management and DMAs to measure and suppress leakage, and the network topology that decides how easily you can zone the system in the first place. The rest of this article is about measuring the real-loss problem honestly and knowing how far to push it.
5 · Measuring real losses properly — UARL and the ILI
How leaky is "leaky"? Litres per day means nothing without context: a 2,000-km network will always lose more than a 50-km one. The IWA solution is to compare your Current Annual Real Losses (CARL) against a physics-based floor — the Unavoidable Annual Real Losses (UARL): the lowest leakage a well-run network of that exact size and pressure could achieve, with today's technology and unlimited budget[4].
where \(L_m\) is mains length (km), \(N_c\) the number of service connections, \(L_p\) the total length of private underground pipe (km, from the street edge to the customer meter), and \(P\) the average operating pressure (m). The three coefficients capture the three places water unavoidably escapes: the mains, the connections, and the customer's own pipe. Divide your real losses by this floor and you get the dimensionless Infrastructure Leakage Index[4][5]:
An ILI of 1.0 is the theoretical best; an ILI of 4 means you are losing four times the unavoidable minimum. Because it is normalised for length, connections and pressure, the ILI lets you compare a Riyadh network with a London one, or track one network honestly across the years even as it grows. The World Bank maps it onto management bands[5]:
| ILI band | ILI (developed) | What it means |
|---|---|---|
| A | 1 – 2 | Excellent — further loss reduction may be uneconomic |
| B | 2 – 4 | Good — scope to improve in specific areas |
| C | 4 – 8 | Poor — intensify pressure management and ALC |
| D | > 8 | Very inefficient — resource-poor management of loss |
6 · Interactive: UARL & the Infrastructure Leakage Index
Enter your network's size and pressure to compute the unavoidable floor, then set your current real losses to read the ILI. (For clarity this calculator assumes meters at the property boundary, so the private-pipe term \(L_p\) is taken as zero — add it where customer meters sit well inside the plot.) Watch how the floor itself rises with pressure: drop the average pressure and even the unavoidable minimum falls, which is exactly why pressure management is the first move.
A 250-km, 20,000-connection network at 45 m has an unavoidable floor near 920 m³/d. Losing 4,000 m³/d puts the ILI at about 4.3 — band C, "intensify control." Now drop the pressure to 35 m: the floor falls and, in reality, so would your actual losses (via the FAVAD law) — the two moves compound.
7 · The four pillars of leakage management
Real losses are held down by four levers acting together — the IWA's "four pillars." Take away any one and leakage creeps back up toward the unmanaged level[2][6]:
- Pressure management. The highest-return, lowest-cost lever: lower the average zone pressure to what the service needs and every leak shrinks at once, and fewer new bursts form. (See pressure management & DMAs.)
- Active leakage control (ALC). Don't wait for leaks to surface — go looking. DMA night-flow monitoring flags which zone is leaking; acoustic loggers, correlators and step tests pinpoint where.
- Speed & quality of repairs. A located leak keeps running until it is fixed; shortening the awareness-location-repair time directly cuts the volume lost per leak.
- Asset management & renewal. Targeted mains and service-connection replacement lowers the burst frequency the other three pillars have to fight — the long-term floor.
8 · The economic level of leakage
You can almost always find and fix one more leak — but should you? Beyond a point, the cost of looking harder exceeds the value of the water you would save. That crossover is the Economic Level of Leakage (ELL): the leakage at which the total cost to the utility is lowest[6][7].
Two costs pull in opposite directions. The value of water lost rises with leakage — more leakage, more wasted production. The cost of active leakage control rises as leakage falls — to hold a lower level you must survey more often and chase smaller leaks. Add them and the total is a U-shaped curve; its lowest point is the ELL. Pushing leakage below the ELL is not "better" — it is spending two pounds to save one.
9 · Interactive: the economic level of leakage
The red curve is the rising value of water lost; the amber curve is the cost of the leakage control needed to hold each level; the navy curve is their sum. The marker sits at the economic level of leakage — the minimum of the total. Move your current leakage to see how much you could save by reaching the ELL — or whether you have already over-invested past it.
With water at $0.60/m³ and a $400k/yr control budget, the economic level sits near 1,350 m³/d. Sitting at 3,000 m³/d costs about $0.2M/yr more than necessary — that gap is your business case for more ALC. Push the unit cost of water up (scarcity, energy, desalinated supply) and the optimum moves left: the more your water is worth, the harder it pays to chase the leaks.
10 · The NRW management checklist
- Meter the system input — you cannot balance what you cannot measure; bulk-meter every source and import.
- Build the IWA water balance — split NRW into real, apparent and unbilled; report volumes, not just a percentage[1].
- Compute the ILI — normalise real losses against UARL so you can benchmark and track honestly over time[4].
- Attack apparent loss in parallel — meter testing/right-sizing, billing-data audits, and enforcement; this is the cheapest revenue you will ever recover.
- Work the four pillars — pressure management first, then active leakage control, fast repairs, and targeted renewal[2].
- Zone the network — establish DMAs and monitor minimum night flow so leakage is found in days, not when it surfaces.
- Find the economic level — set the leakage target at the ELL, and revisit it whenever the cost of water changes[6].
- Make it permanent — NRW reduction is not a project but a standing programme; without it, leakage rebounds toward the unmanaged level.
References & standards
- American Water Works Association. Manual M36 — Water Audits and Loss Control Programs (the IWA/AWWA water balance, NRW components, validity scoring).
- Farley, M. & Trow, S. Losses in Water Distribution Networks: A Practitioner's Guide to Assessment, Monitoring and Control. IWA Publishing.
- IWA Water Loss Specialist Group. Best Practice Standard Water Balance and terminology (Alegre et al., performance indicators).
- Lambert, A.O. & Hirner, W. (2000). Losses from Water Supply Systems: Standard Terminology and Recommended Performance Measures — the UARL formula and the Infrastructure Leakage Index.
- Liemberger, R. & McKenzie, R. Accuracy Limitations of the ILI — Is it an Appropriate Indicator for Developing Countries? (World Bank Institute ILI management bands).
- Thornton, J., Sturm, R. & Kunkel, G. Water Loss Control. McGraw-Hill — four pillars, ALC, and economic intervention.
- UKWIR / Tripartite Group. Best Practice Principles in the Economic Level of Leakage Calculation.
- World Bank. The Challenge of Reducing Non-Revenue Water in Developing Countries (Kingdom, Liemberger & Marin) — PPP and programme economics.