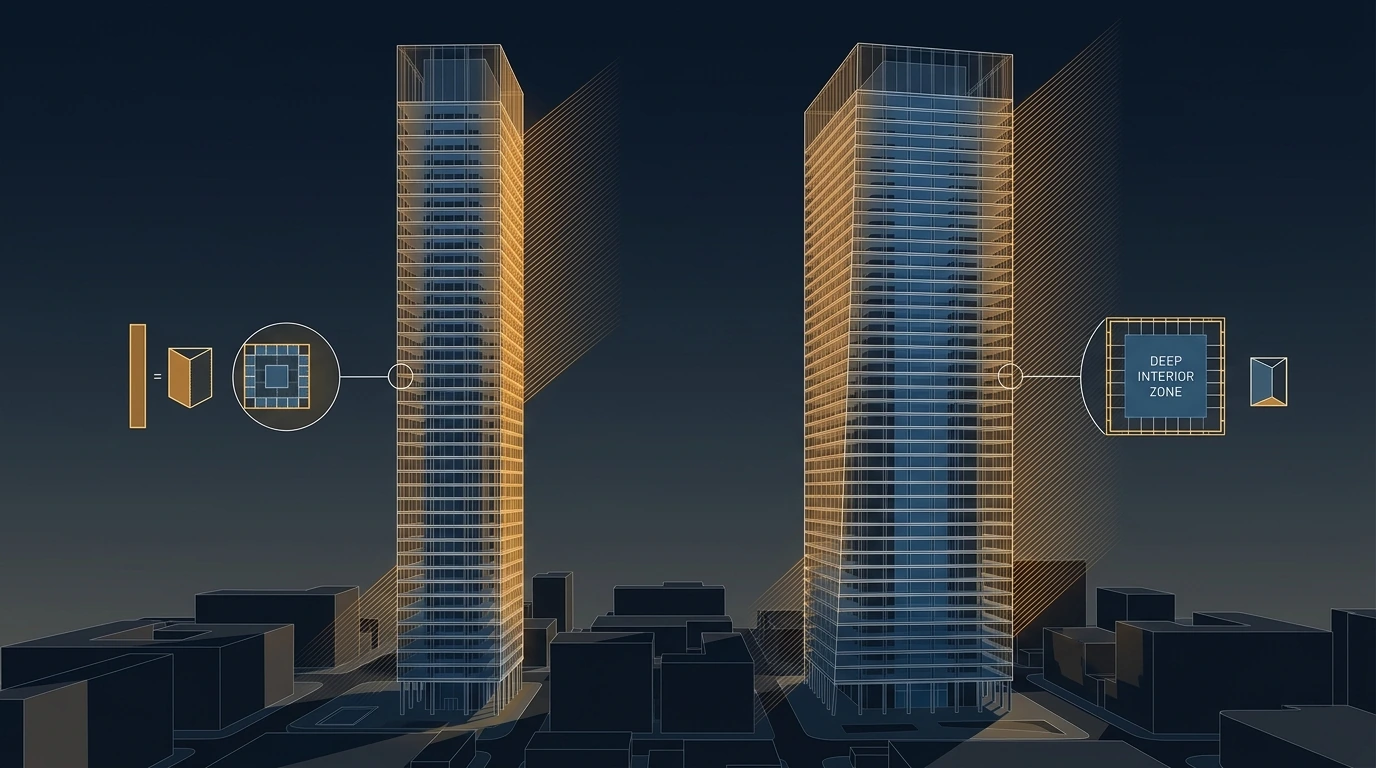
Two towers of identical height and identical total area can have completely different cooling loads, different plant, different riser strategies and different economics — because one has a 30 m floor plate and the other a 60 m one. The slender tower carries twice as much façade per square metre of floor, which makes it an envelope-driven building where 60 % of the load comes through the glass; the wide one is internally driven, where the people, lights and equipment dominate. Almost every subsequent decision — where the plant goes, whether perimeter systems are needed, how the zones are controlled, what the diversity is — follows from which of those two buildings you are designing, and it is decided by the architect's massing long before the first load calculation.
1 · Geometry is the load
For a square floor plate of side \(s\) and floor-to-floor height \(h\), the façade area per unit of floor area is simply:
It depends on the plate size, not on the building height at all. A 30 m plate at 4 m floor-to-floor carries 0.53 m² of façade per m² of floor; a 60 m plate carries 0.27. That single ratio decides the character of the building:
- Slender towers are envelope-dominated. Solar and conduction gains scale with that ratio, so they peak sharply with orientation and time of day, they vary enormously between façades, and they demand perimeter treatment and orientation-based zoning.
- Wide-plate towers are internally dominated. Lights, equipment and people dominate, loads are steadier, deep space needs cooling all year even in winter, and simultaneous heating and cooling on the same floor becomes a real design problem.
- Residential and hotel towers are almost always slender — because every room needs a window — which is why they behave so differently from offices and why office rules of thumb mislead badly when applied to them.
2 · Interactive: envelope versus internal load
At a 45 m plate the two halves are almost exactly balanced. Slide down to a 30 m residential plate and the envelope takes 60 %; slide up to 60 m and it falls to 43 %. These are different buildings. The slender one wants perimeter fan-coils or an active façade, tight orientation zoning, and a plant sized for a sharp, orientation-dependent peak. The wide one wants deep-plan air distribution, year-round cooling in the core, and careful attention to simultaneous heating and cooling. Applying the wrong template is the most consequential early error in tall-building HVAC, and the two templates are separated by nothing more than a dimension on the architect's plan.
3 · What actually changes with height
Height itself changes less than people expect, but what it does change is systematic:
- Shading disappears. Near grade a tower is shaded by its neighbours for much of the day; above the urban canopy it is not. The upper third of a tower can receive close to twice the solar gain of the lower third on the same orientation, for identical glass — and that is a zoning decision, not a glazing one.
- Air temperature falls slightly — roughly 0.65 °C per 100 m — which very marginally helps.
- Wind increases sharply, raising the external film coefficient and therefore the conduction gain, and driving the infiltration described in stack effect.
- Infiltration becomes a real load rather than a rounding error, and it is not uniform — it is concentrated below the neutral plane in winter and above it in a Gulf summer.
- Occupancy patterns differ by zone, but the chilled-water peaks mostly do not. Offices, hotel rooms and residences keep different hours, and a hotel's busiest evening or a residence's late-night occupancy is real. On chilled water in a Gulf summer, though, all three draw their peak in the same afternoon: offices between 14:00 and 15:00, hotel rooms and residences between 16:00 and 17:00, because sun on glass, infiltration and outdoor air dominate each of them. Section 4 shows how much diversity that leaves.
The same glass, the same orientation, and a 2.5× difference in peak solar gain between the podium floors and the crown. Designing every floor to the same W/m² therefore over-sizes the bottom of the tower and under-sizes the top — and because plant is zoned vertically anyway, the fix is nearly free: apply different load densities to different vertical zones, and check the shading with a real solar study rather than a rule of thumb. Note also that the shading benefit at low level is a borrowed benefit; it disappears if the neighbouring site is redeveloped taller, which on a prime site over a sixty-year life is not a remote possibility.
4 · Interactive: how much diversity a mixed-use tower really has
Connected load is the sum of every zone's own peak. The simultaneous load, the block load, is the highest hour of their sum, and it is always less, because not everything peaks in the same hour. The block load is the number the codes size equipment on. ASHRAE 90.1 (§6.4.2.1) and the Saudi Building Code (SBC 501, §312.1) require system design loads to be calculated to ANSI/ASHRAE/ACCA Standard 183. In practice that means an hour-by-hour calculation using the load methods of the ASHRAE Fundamentals handbook. How far the block falls below the connected load depends on what drives the load:
- Weather-driven load means solar gain, conduction, infiltration and outdoor air at its design rate. It gets no usage diversity. The sun reaches every west-facing floor at the same moment, whether the rooms are let or not. Its only diversity is time: east and west façades peak hours apart.
- Usage-driven load means people, lighting, equipment, demand-controlled ventilation and process loads. It is statistical. Not every room is let and not every desk is busy, and the effect grows with the number of independent units. Measured office equipment runs at about 60–75 % of its peak draw at the design hour (Wilkins & Hosni, ASHRAE Journal, 2011). ASHRAE research project RP-1093 built a library of lighting and equipment diversity factors from metered office buildings for exactly this use.
In a glass tower in a hot climate, more than half of the connected load is weather-driven. That is why the tower's diversity is much smaller than a rule of thumb built on occupancy alone would suggest.
With the defaults, the tower coincidence is about 0.86, so a 50 MW connected load is a 43 MW plant. N+1 on a six-unit set brings the installed capacity back to roughly the connected load. In a hot climate, diversity pays for the standby chiller; it does not halve the plant. A blanket 0.55 applied to this tower would leave the plant 36 % short on the design day. Lower the weather-driven share, as in a cooler climate or a building dominated by people and equipment, and the figure moves down. It moves slowly, though, because the usage-driven share also has its own floor. Take too much diversity and the plant is short on the first hot afternoon. Take none and the plant is about 17 % larger than it needs to be.
5 · Modelling a tower honestly
- Zone by orientation and by height, not by floor. A 150-storey model with every floor represented is unmanageable and no more accurate; a model with representative floors per vertical zone and per orientation captures what matters.
- Include the stack effect. Most whole-building models treat infiltration as a constant air change rate, which is exactly wrong for a tower — infiltration is concentrated at the base in winter and at the top in a Gulf summer, and it is one of the largest single loads. Use a model that couples airflow to the thermal simulation, or at least apply a height-varying infiltration profile.
- Model the real occupancy schedules per use, because the usage-driven part of the diversity is a scheduling result. A mixed-use tower modelled with one office schedule throughout will get the peak hour, and therefore the block, wrong.
- Calibrate the glazing model against the actual specification, including frames, spandrel panels and the shading that is actually built rather than the shading that is rendered.
- Test the model's sensitivity to the three parameters that dominate: SHGC, internal gain density and infiltration. If the answer swings wildly on any of them, that is where the design effort belongs.
- Do not confuse peak sizing with energy. Peak sizing sets the plant; annual simulation sets the running cost and the control strategy. They are different exercises with different assumptions, and using peak-day assumptions for an annual model is a common and expensive error.
6 · From model to plant — the practical steps
- Write down the diversity you took and why. The single most useful line in a design report is an explicit statement of the assumed diversity, the basis for it and what would invalidate it. The basis should be an hourly block calculation, not a percentage. It is also the line that protects you if the building's use changes.
- Give each vertical zone its own load density. Solar-driven differences of 2× between bottom and top are real and free to exploit, because the plant is zoned anyway.
- Separate the perimeter from the core in the control strategy, even where a single system serves both — they peak at different times and in opposite directions.
- Design for turndown, not just for peak. A plant sized on a diversified peak spends its life well below it; staging, minimum flows and low-load stability matter more than the last percent of full-load efficiency.
- Leave space for a future tenant load. A trading floor, a kitchen or a data room appearing mid-life is normal in a landmark tower; leaving riser and plant capacity for it is far cheaper than adding it later.
- Re-run the model at the end of design against the specification that was actually procured, not the one that was assumed at concept — the glazing and the lighting density both routinely change.
- Compare against measured data at handover and keep the model. A calibrated model is the tool that answers every future question about the building, and it is almost always thrown away.
7 · The design & modelling checklist
- Establish the façade ratio first — it tells you whether the building is envelope- or internally-driven and which template applies.
- Zone by orientation and by height, with different load densities per vertical zone.
- Run a real solar study including the surrounding fabric and the risk of it changing.
- Couple infiltration to stack effect rather than assuming a uniform air change rate.
- Take diversity from an hourly block calculation with use-specific schedules, applying usage diversity only to people-driven loads, and state it explicitly.
- Test sensitivity to SHGC, internal gains and infiltration.
- Size on the diversified simultaneous peak with a stated redundancy.
- Design for turndown and leave capacity for future tenant loads.
- Re-run against the procured specification and calibrate against measured data at handover.
References & standards
- ASHRAE Handbook — Fundamentals: Nonresidential Cooling and Heating Load Calculations (Radiant Time Series), Fenestration, and Climatic Design Information.
- ASHRAE Design Guide for Tall, Supertall, and Megatall Building Systems, 2nd ed. — load characteristics, vertical zoning and diversity in tall buildings.
- CIBSE Guide A — Environmental Design and CIBSE TM52 / TM54 — load calculation, design criteria and operational energy prediction.
- ANSI/ASHRAE Standard 140 — Method of Test for Evaluating Building Performance Simulation Software; and ASHRAE Guideline 14 for model calibration against measured data.
- ANSI/ASHRAE/IES Standard 90.1, Appendix G — whole-building performance modelling protocol; and Estidama / Mostadam / LEED energy modelling requirements.
- ASHRAE Handbook — Fundamentals, Ventilation and Infiltration chapter — stack-driven infiltration in tall buildings and its coupling to thermal load.
- CTBUH technical guidance on façade performance and solar exposure in tall buildings.
- Saudi Building Code SBC 601 (energy conservation) and SBC 501 — envelope and mechanical requirements for the region; SBC 501 §312.1 requires system design loads to be determined to ASHRAE/ACCA Standard 183.
- ANSI/ASHRAE/ACCA Standard 183, Peak Cooling and Heating Load Calculations in Buildings Except Low-Rise Residential Buildings — the design load procedure required for equipment sizing by ASHRAE 90.1 §6.4.2.1.
- Wilkins, C.K. and Hosni, M.H. “Plug Load Design Factors.” ASHRAE Journal 53(5), May 2011, pp. 30–34 — measured diversity of office equipment (75 % for computers, 60 % for monitors) and design load factors.
- Abushakra, B., Haberl, J.S. and Claridge, D.E. “Overview of Existing Literature on Diversity Factors and Schedules for Energy and Cooling Load Calculations.” ASHRAE Transactions 110(1), 2004 (ASHRAE RP-1093) — lighting and equipment diversity factors from metered office buildings.
- Abokhatwa, M. Chilled-Water Diversity in Megatall Towers, 2026, with the hourly block model published as source code — the calculation behind the 0.86 used here.