Introduction
Of all the parameters that define the performance of a hydropneumatic surge vessel, none is more consequential — or more frequently set incorrectly — than the pre-charge pressure (P₀). It is the initial pressure of the gas cushion inside the vessel under normal steady-state operating conditions, and it directly governs how much water the vessel can expel during a down-surge and how much it can absorb during an up-surge.
A wrong P₀ — even by 10 to 20% — can render an otherwise correctly sized vessel completely ineffective: unable to prevent column separation during a pump trip, or unable to limit the up-surge within the pipe class rating. In this article, I explain the physical mechanism, quantify the effect with worked numerical examples, demonstrate the impact through Bentley HAMMER simulation results, and describe the field consequences I have encountered in practice.
1. What is Pre-Charge Pressure?
The surge vessel contains a gas cushion — typically nitrogen — separated from the water by a bladder or a free gas-water interface. Under normal steady-state operation, this gas is compressed to a pressure that exactly matches the pipeline pressure at the vessel tap point. This is the pre-charge pressure P₀.
At P₀, the vessel is in perfect equilibrium: no water flows in or out, and the gas occupies its design volume V₀ — typically 40 to 50% of the total vessel volume. When the pipeline pressure changes during a transient event, the gas cushion expands or compresses accordingly, and water flows in or out to maintain equilibrium.
2. The Physics — Why P₀ Governs Everything
The gas cushion behaviour is governed by the polytropic gas law:
Rearranging for the gas volume at each state:
Both equations show that P₀ appears in the numerator of the pressure ratio. This creates a fundamental tension in surge vessel design:
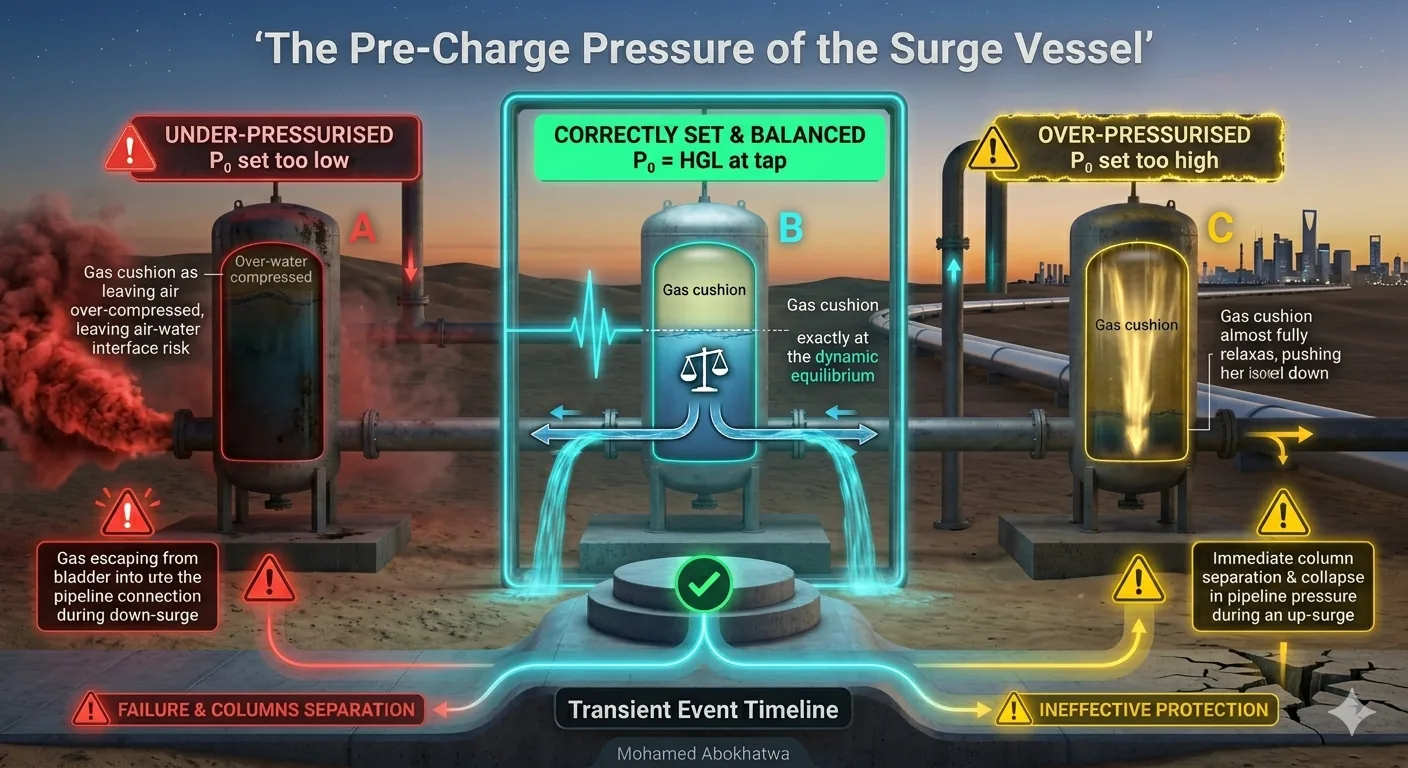
- A higher P₀ means the gas is more compressed at steady state → less room to expand during down-surge → reduced water expulsion capacity
- A lower P₀ means the gas is more relaxed at steady state → more room to expand → but the gas will compress excessively during up-surge → risk of gas depletion and water reserve loss
Setting P₀ correctly at the actual pipeline HGL is the only way to balance these two competing requirements.
3. Worked Example — Three P₀ Scenarios
Using the same system from the previous article: DN 800 mm Ductile Iron pipeline, 12 km, pump discharge head 85.0 m, pipe class PN 16 (max allowable 136 m), minimum allowable pressure +3.0 m gauge. Vessel total volume fixed at 8.0 m³, initial gas volume V₀ = 4.0 m³ (50% ratio).
We examine three P₀ scenarios reflecting the most common errors in practice:
Calculations
Using P₁ = 1.30 bar abs (P_min = +3.0 m gauge + atmospheric), P₂ = 14.3 bar abs (P_max = 136 m + atmospheric), n = 1.2, V₀ = 4.0 m³:
| Scenario | P₀ (bar abs) | V₁ at P_min (m³) | Water expelled (m³) | V₂ at P_max (m³) | Water absorbed (m³) | Assessment |
|---|---|---|---|---|---|---|
| A — Under | 0.50 | 1.41 | −2.59 ⚠ | 0.03 | 3.97 | FAIL |
| B — Correct | 1.84 | 5.36 | +1.36 ✓ | 0.49 | 3.51 | PASS |
| C — Over | 2.50 | 7.93 | +3.93 ⚠ | 0.67 | 3.33 | RISK |
Figure 1 — Water expelled and absorbed vs. P₀ (vessel 8.0 m³, V₀ = 4.0 m³, n = 1.2)
4. The Most Common Mistake — Pump Head vs. HGL at Tap Point
In practice, the most frequent P₀ error is confusing the pump total dynamic head (TDH) with the HGL at the vessel tap point. On a long pipeline with friction losses, these values can differ substantially.
| Location | HGL (m) | Absolute Pressure (bar abs) | P₀ error if used | Assessment |
|---|---|---|---|---|
| Pump TDH (at impeller) | 98.0 | 1.96 | +6.5% | Over by 6.5% |
| Vessel tap (5 m downstream) | 85.0 | 1.84 | 0% | Correct ✓ |
| 50 m downstream | 84.8 | 1.83 | −0.5% | Negligible |
| 500 m downstream | 79.6 | 1.77 | −3.8% | Under by 3.8% |
| 2,000 m downstream | 63.4 | 1.63 | −11.4% | Under by 11% |
| 6,000 m downstream | 35.1 | 1.40 | −24% | Severe underestimate |
This table confirms two important design rules:
- The vessel must be located as close as possible to the pump discharge — ideally within 30 to 50 m — to minimise the HGL drop between pump and vessel
- P₀ must always be read from the steady-state hydraulic model at the exact tap node — never estimated from the pump curve or system design pressure
Figure 2 — HGL along pipeline and resulting P₀ error if vessel were placed at different locations
5. Effect of P₀ Error on Required Vessel Volume
If P₀ is set incorrectly, the 8.0 m³ vessel will no longer deliver the required water expulsion of 1.36 m³. To compensate, a larger vessel is needed. The table below quantifies the volume penalty for each level of P₀ error:
| P₀ error | P₀ (bar abs) | Required V₀ (m³) | Required total vessel (m³) | Volume penalty |
|---|---|---|---|---|
| −15% | 1.56 | 7.21 | 14.4 | +80% |
| −11% | 1.64 | 5.84 | 11.7 | +46% |
| −5% | 1.75 | 4.68 | 9.4 | +18% |
| 0% (correct) | 1.84 | 4.0 | 8.0 | Baseline |
| +5% | 1.93 | 3.42 | 6.8 | −15% (up-surge risk) |
| +11% | 2.04 | 2.96 | 5.9 | −26% (significant risk) |
The asymmetry is striking and has a direct cost implication: a P₀ underestimate of just 11% — which can easily occur if the designer uses the pump head (98 m) instead of the actual HGL at the tap point (85 m) — requires a vessel 46% larger to maintain the same level of down-surge protection. For a large vessel this translates directly to significant additional capital cost.
Figure 3 — Required vessel volume vs. P₀ error (red = under-estimate, green = correct, amber = over-estimate)
6. Bentley HAMMER — Same Vessel, Three P₀ Settings
To validate the analytical findings, the DN 800 mm system was re-run in Bentley HAMMER with the 8.0 m³ vessel — fixed volume, but with three different P₀ settings. All other parameters were held constant.
| P₀ Setting | Max Head at Pump (m) | Min Head at Midpoint (m) | Max Limit (m) | Min Limit (m) | Result |
|---|---|---|---|---|---|
| 0.50 bar abs — Scenario A | 208.4 | −22.6 | 136 | +3.0 | FAIL — both |
| 1.84 bar abs — Scenario B | 128.6 | +4.2 | 136 | +3.0 | PASS ✓ |
| 2.50 bar abs — Scenario C | 121.8 | −1.2 | 136 | +3.0 | FAIL — min pressure |
The Bentley HAMMER results are unambiguous:
- Scenario A — the vessel is non-functional. Maximum pressure is almost identical to the completely unprotected case (217.5 m from our previous article). Column separation occurs across the full pipeline length. The 8.0 m³ vessel provides no protection whatsoever.
- Scenario B — full protection as designed. Both pressure limits are satisfied with adequate margin. This is the baseline confirmed in our previous article.
- Scenario C — the up-surge is slightly better controlled (lower max head = 121.8 m vs 128.6 m), but the minimum pressure at the midpoint drops to −1.2 m — below the +3.0 m minimum limit. The over-compressed gas cushion leaves insufficient expulsion capacity during the down-surge.
Figure 4 — Pressure vs. time at pump discharge for the three P₀ scenarios (Bentley HAMMER)
7. How to Set P₀ Correctly — Step by Step
Step 1 — Extract the HGL from the steady-state model
Run the steady-state hydraulic model and record the HGL at the exact node where the vessel branch connects to the main pipeline. This is a specific model node — not an average, not the pump outlet pressure, and not a hand-calculated estimate.
Step 2 — Convert to absolute pressure
Step 3 — Check for multiple operating modes
In systems with variable speed pumps, multiple pump configurations, or seasonal demand variation, the HGL at the vessel tap point will vary. The P₀ must be set for the most critical operating condition — typically the condition that produces the most severe transient. The transient analysis must be verified for all credible operating scenarios.
Step 4 — Verify in Bentley HAMMER
Input P₀ into the surge vessel node in Bentley HAMMER. The software will flag a steady-state mismatch warning if the vessel pre-charge pressure does not match the pipeline HGL at that node. This warning must never be dismissed without investigation — it is the model confirming that P₀ is incorrectly set.
Step 5 — Document and specify for commissioning
The P₀ value must be explicitly stated in the vessel data sheet, the commissioning checklist, and the O&M manual. The field commissioning team must verify P₀ using the vessel pressure gauge before the system is put into service.
8. Field Consequences of Wrong P₀
In over 22 years of practice on water transmission projects, I have encountered three recurring field consequences of incorrectly set pre-charge pressure:
8.1 Gas release into the pipeline
When P₀ is set too low, the gas cushion expands excessively during each pump start-stop cycle. Over time, gas escapes past the bladder or free interface and enters the pipeline. This causes air binding at high points, erratic flow meter readings, and unexplained pressure fluctuations — all of which are frequently misdiagnosed as air valve malfunction rather than a surge vessel P₀ error.
8.2 Persistent column separation despite vessel installation
This is the most dangerous consequence. The client and contractor observe that a surge vessel has been installed and assume the system is protected. But if P₀ is wrong, the vessel may provide no down-surge protection at all. Column separation occurs, pipe joints pull out or cracks develop, and the vessel is blamed — when the real cause is a P₀ error that was never detected because the transient model was not properly validated at commissioning.
8.3 Vessel waterlogging over time
When P₀ is set too high, the gas cushion is over-compressed. During normal operation, small pressure fluctuations cause water to gradually displace the gas through micro-leaks in the bladder or accumulator valve. Over months of operation, the vessel becomes waterlogged — 80 to 90% water — with almost no gas cushion remaining. This condition is undetectable without a pressure gauge and without a periodic inspection protocol. A waterlogged vessel is completely ineffective as a surge protection device.
9. Design Checklist — Pre-Charge Pressure
| # | Check Item | Priority |
|---|---|---|
| 1 | P₀ extracted from steady-state model at exact vessel tap node — not estimated | Critical |
| 2 | P₀ converted to absolute pressure (add 10.33 m atmospheric) | Critical |
| 3 | P₀ confirmed to match pipeline HGL — not pump TDH | Critical |
| 4 | Head loss in vessel connection pipe calculated and accounted for | Important |
| 5 | Bentley HAMMER steady-state mismatch warning — confirmed absent | Critical |
| 6 | Transient verified for all operating modes including minimum and maximum flow | Important |
| 7 | P₀ value stated explicitly on vessel data sheet and commissioning checklist | Critical |
| 8 | Pressure gauge specified on vessel — visible, calibrated, accessible | Critical |
| 9 | Annual P₀ verification included in O&M manual and maintenance schedule | Important |
10. Conclusion
The pre-charge pressure P₀ is the single most sensitive parameter in surge vessel design. It is not a default value, not the pump head, and not an approximation — it is a precisely defined quantity derived from the steady-state hydraulic model at the exact vessel connection point, converted to absolute pressure.
As this article has demonstrated through worked numerical examples and Bentley HAMMER simulation results:
- A P₀ set too low renders the vessel incapable of expelling water during a down-surge — providing zero protection against column separation, regardless of vessel volume
- A P₀ set correctly at 1.84 bar abs delivers full protection in both directions — confirming the 8.0 m³ vessel sizing from the previous article
- A P₀ set too high leads to gas ingress into the pipeline and vessel waterlogging over time
- A P₀ underestimate of just 11% requires a vessel 46% larger to compensate — at significant additional capital cost
Get P₀ right, and your surge vessel will perform exactly as designed. Get it wrong, and no amount of vessel volume will save the system.
References
- Chaudhry, M.H. (2014). Applied Hydraulic Transients, 3rd ed. Springer.
- Wylie, E.B. and Streeter, V.L. (1993). Fluid Transients in Systems. Prentice Hall.
- Thorley, A.R.D. (2004). Fluid Transients in Pipeline Systems, 2nd ed. Professional Engineering Publishing.
- Bentley Systems (2023). Bentley HAMMER V8i — User Guide and Reference Manual. Bentley Systems Inc.
- AWWA M51 (2017). Air-Release, Air/Vacuum, and Combination Air Valves. American Water Works Association.
- Simpson, A.R. and Bergant, A. (1994). Numerical comparison of pipe-column-separation models. Journal of Hydraulic Engineering, ASCE, 120(3), 361–377.
- Skulovich, O. et al. (2015). Optimal placement and sizing of surge tanks in water supply systems. Procedia Engineering, 119, 816–825.
- BS EN 805 (2000). Water supply — Requirements for systems and components outside buildings. BSI.